GE 2010 Annual Report Download - page 87
Download and view the complete annual report
Please find page 87 of the 2010 GE annual report below. You can navigate through the pages in the report by either clicking on the pages listed below, or by using the keyword search tool below to find specific information within the annual report.-
 1
1 -
2
-
3
-
4
-
5
-
6
-
7
-
8
-
9
-
10
-
11
-
12
-
13
-
14
-
15
-
16
-
17
-
18
-
19
-
20
-
21
-
22
-
23
-
24
-
25
-
26
-
27
-
28
-
29
-
30
-
31
-
32
-
33
-
34
-
35
-
36
-
37
-
38
-
39
-
40
-
41
-
42
-
43
-
44
-
45
-
46
-
47
-
48
-
49
-
50
-
51
-
52
-
53
-
54
-
55
-
56
-
57
-
58
-
59
-
60
-
61
-
62
-
63
-
64
-
65
-
66
-
67
-
68
-
69
-
70
-
71
-
72
-
73
-
74
-
75
-
76
-
 77
77 -
 78
78 -
 79
79 -
 80
80 -
 81
81 -
 82
82 -
 83
83 -
 84
84 -
 85
85 -
 86
86 -
 87
87 -
 88
88 -
 89
89 -
 90
90 -
 91
91 -
 92
92 -
 93
93 -
 94
94 -
 95
95 -
 96
96 -
 97
97 -
98
-
99
-
100
-
101
-
102
-
103
-
104
-
105
-
106
-
107
-
108
-
109
-
110
-
111
-
112
-
113
-
114
-
115
-
116
-
117
-
118
-
119
-
120
-
121
-
122
-
123
-
124
-
125
-
126
-
127
-
128
-
129
-
130
-
131
-
132
-
133
-
134
-
135
-
136
-
137
-
138
-
139
-
140
 |
 |

GE 2010 ANNUAL REPORT 85
If there has been an adverse change in cash flows for RMBS,
management considers credit enhancements such as monoline
insurance (which are features of a specific security). In evaluating
the overall creditworthiness of the Monoline, we use an analysis that
is similar to the approach we use for corporate bonds, including an
evaluation of the sufficiency of the Monoline’s cash reserves and
capital, ratings activity, whether the Monoline is in default or default
appears imminent, and the potential for intervention by an insurer
or other regulator.
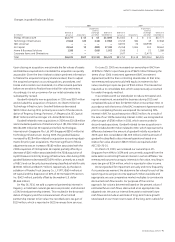
During 2010, we recorded other-than-temporary impairments
of $460 million, of which $253 million was recorded through
earnings ($35 million relates to equity securities) and $207 million
was recorded in accumulated other comprehensive income (AOCI).
At January 1, 2010, cumulative impairments recognized in earn-
ings associated with debt securities still held were $340 million.
During 2010, we recognized first-time impairments of $164 million
and incremental charges on previously impaired securities of
$38 million. These amounts included $41 million related to securi-
ties that were subsequently sold.
During 2009, we recorded other-than-temporary impairments
of $1,078 million, of which $753 million was recorded through
earnings ($42 million relates to equity securities), and $325 million
was recorded in AOCI.
During 2009, we recorded other-than-temporary impairments
of $1,078 million, of which $33 million was reclassified to retained
earnings at April 1, 2009, as a result of the amendments to ASC 320.
Subsequent to April 1, 2009, first-time and incremental credit impair-
ments were $109 million and $257 million, respectively. Previous
credit impairments related to securities sold were $124 million.
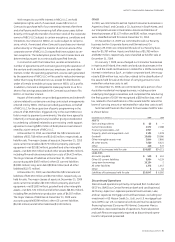
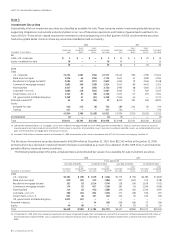
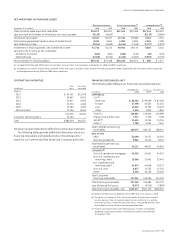
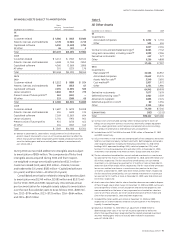
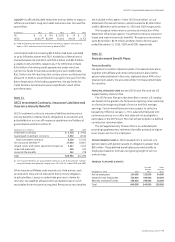
CONTRACTUAL MATURITIES OF GECS INVESTMENT IN AVAILABLE-
FOR-SALE DEBT SECURITIES (EXCLUDING MORTGAGE-BACKED AND
ASSET-BACKED SECURITIES)
Amortized Estimated
(In millions) cost fair value
Due in
2011 $ 3,072 $ 3,169
2012–2015 7,433 7,683
2016–2020 4,371 4,516
2021 and later 17,732 18,429
We expect actual maturities to differ from contractual maturities
because borrowers have the right to call or prepay certain
obligations.
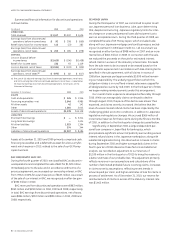
Supplemental information about gross realized gains and
losses on available-for-sale investment securities follows.
(In millions) 2010 2009 2008
GE
Gains $ — $ 4 $ —
Losses, including impairments — (173) (148)
Net — (169) (148)
GECS
Gains 190 164 212
Losses, including impairments (281) (637) (1,472)
Net (91) (473) (1,260)
Total $ (91) $(642) $(1,408)
Although we generally do not have the intent to sell any specific
securities at the end of the period, in the ordinary course of manag-
ing our investment securities portfolio, we may sell securities prior
We adopted amendments to ASC 320 and recorded a cumulative
effect adjustment to increase retained earnings by $62 million as
of April 1, 2009.
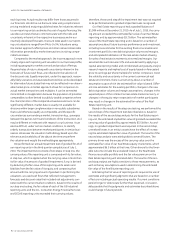
We regularly review investment securities for impairment
using both qualitative and quantitative criteria. We presently do
not intend to sell our debt securities and believe that it is not more
likely than not that we will be required to sell these securities that
are in an unrealized loss position before recovery of our amortized
cost. We believe that the unrealized loss associated with our
equity securities will be recovered within the foreseeable future.
The vast majority of our U.S. corporate debt securities are rated
investment grade by the major rating agencies. We evaluate U.S.
corporate debt securities based on a variety of factors, such as the
financial health of and specific prospects for the issuer, including
whether the issuer is in compliance with the terms and covenants of
the security. In the event a U.S. corporate debt security is deemed to
be other-than-temporarily impaired, we isolate the credit portion of
the impairment by comparing the present value of our expectation
of cash flows to the amortized cost of the security. We discount the
cash flows using the original effective interest rate of the security.
The vast majority of our RMBS have investment grade credit
ratings from the major rating agencies and are in a senior position in
the capital structure of the deal. Of our total RMBS at December 31,
2010 and 2009, approximately $673 million and $897 million, respec-
tively, relate to residential subprime credit, primarily supporting our
guaranteed investment contracts. These are collateralized primarily
by pools of individual, direct mortgage loans (a majority of which were
originated in 2006 and 2005), not other structured products such as
collateralized debt obligations. In addition, of the total residential
subprime credit exposure at December 31, 2010 and 2009, approxi-
mately $343 million and $456 million, respectively, was insured by
Monoline insurers (Monolines) on which we continue to place reliance.
The vast majority of our commercial mortgage-backed securities
(CMBS) also have investment grade credit ratings from the major rating
agencies and are in a senior position in the capital structure of the deal.
Our CMBS investments are collateralized by both diversified pools of
mortgages that were originated for securitization (conduit CMBS)
and pools of large loans backed by high-quality properties (large
loan CMBS), a majority of which were originated in 2006 and 2007.
Our asset-backed securities (ABS) portfolio is collateralized by a
variety of diversified pools of assets such as student loans and
credit cards, as well as large senior secured loans targeting high-
quality, middle-market companies in a variety of industries. The vast
majority of our ABS securities are in a senior position in the capital
structure of the deal. In addition, substantially all of the securities
that are below investment grade are in an unrealized gain position.
For ABS, including RMBS, we estimate the portion of loss attrib-
utable to credit using a discounted cash flow model that considers
estimates of cash flows generated from the underlying collateral.
Estimates of cash flows consider internal credit risk, interest rate
and prepayment assumptions that incorporate management’s
best estimate of key assumptions, including default rates, loss
severity and prepayment rates. For CMBS, we estimate the portion
of loss attributable to credit by evaluating potential losses on each
of the underlying loans in the security. Collateral cash flows are
considered in the context of our position in the capital structure
of the deal. Assumptions can vary widely depending upon the
collateral type, geographic concentrations and vintage.