GE 2010 Annual Report Download - page 2
Download and view the complete annual report
Please find page 2 of the 2010 GE annual report below. You can navigate through the pages in the report by either clicking on the pages listed below, or by using the keyword search tool below to find specific information within the annual report.
155
182
172
151 150
20072006 2008 2009 2010
CONSOLIDATED REVENUES
(In $ billions)
10.9
18.0
22.4
19.3
12.6
20072006 2008 2009 2010
EARNINGS FROM CONTINUING OPERATIONS
ATTRIBUTABLE TO GE
(In $ billions)
16.8
16.0
13.9
2007
2006
GECS
Dividend*
Industrial
CFOA
2008 2009 2010
23.3
23.8
19.1
16.4 14.7
CASH FLOW FROM OPERATING ACTIVITIES
(In $ billions)
*No GECS dividend paid in 2009 and 2010.
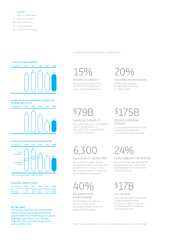
15%
RETURN TO GROWTH
Disciplined execution drove
a 15% rise in GE earnings
from continuing operations
20%
INVESTING IN INNOVATION
GE boosted company-
funded R&D spending
by 20% in 2010
$79B
FINANCIAL FLEXIBILITY
GE had $79 billion in consolidated
cash and equivalents at
year-end 2010, with $19 billion
in cash at the parent
$175B
RECORD INDUSTRIAL
BACKLOG
Strong equipment and services
orders growth resulted in
a record $175 billion backlog
6,300
U.S. MANUFACTURING JOBS
In the past two years, GE has
announced creation of more than
6,300 new U.S. manufacturing
jobs, many in regions hardest hit
by the economic recession
24%
TOTAL SHAREHOLDER RETURN
GE total shareholder return (TSR)
appreciated 24% in 2010, nine
percentage points better than
the S&P 500 TSR
40%
DELIVERING FOR
SHAREOWNERS
Two dividend increases in
2010 provided a total
40% improvement versus the
beginning of the year
On the cover
GE’s product and services offerings are
aligned with human needs and growth
opportunities around the world. As global
population has grown over the past
118 years, GE’s revenue has grown at
an even faster rate.
$17B
U.S. EXPORTS
International sales of American-
made products totaled
$17 billion in 2010, more than
double the level of company
U.S. exports in 2001
CONTENTS
1 Letter to Shareowners
9 Business Overview
28 Board of Directors
29 Financial Section
136 Corporate Information
Note: Financial results from continuing operations unless otherwise noted.
(20)%16%11%GE (39)%
(40)%(7)%14%S&P 500 15%
2006 2007 2008 2009
15%
47%
2010
EARNINGS GROWTH RATES
(In $ billions)
financial and strategic highlights

