GE 2010 Annual Report Download - page 46
Download and view the complete annual report
Please find page 46 of the 2010 GE annual report below. You can navigate through the pages in the report by either clicking on the pages listed below, or by using the keyword search tool below to find specific information within the annual report.-
 1
1 -
2
-
3
-
4
-
5
-
6
-
7
-
8
-
9
-
10
-
11
-
12
-
13
-
14
-
15
-
16
-
17
-
18
-
19
-
20
-
21
-
22
-
23
-
24
-
25
-
26
-
27
-
28
-
29
-
30
-
31
-
32
-
33
-
34
-
35
-
 36
36 -
 37
37 -
 38
38 -
 39
39 -
 40
40 -
 41
41 -
 42
42 -
 43
43 -
 44
44 -
 45
45 -
 46
46 -
 47
47 -
 48
48 -
 49
49 -
 50
50 -
 51
51 -
 52
52 -
 53
53 -
 54
54 -
 55
55 -
 56
56 -
57
-
58
-
59
-
60
-
61
-
62
-
63
-
64
-
65
-
66
-
67
-
68
-
69
-
70
-
71
-
72
-
73
-
74
-
75
-
76
-
77
-
78
-
79
-
80
-
81
-
82
-
83
-
84
-
85
-
86
-
87
-
88
-
89
-
90
-
91
-
92
-
93
-
94
-
95
-
96
-
97
-
98
-
99
-
100
-
101
-
102
-
103
-
104
-
105
-
106
-
107
-
108
-
109
-
110
-
111
-
112
-
113
-
114
-
115
-
116
-
117
-
118
-
119
-
120
-
121
-
122
-
123
-
124
-
125
-
126
-
127
-
128
-
129
-
130
-
131
-
132
-
133
-
134
-
135
-
136
-
137
-
138
-
139
-
140
 |
 |

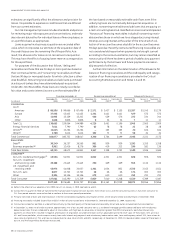
management’s discussion and analsis
44 GE 2010 ANNUAL REPORT
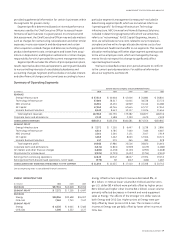
In 2010, underabsorbed corporate overhead increased by
$0.2 billion, primarily related to increased costs at our global
research centers. Other operating profit (cost) decreased $0.4 bil-
lion in 2010 as compared with 2009, as lower restructuring and
other charges (including environmental remediation costs related
to the Hudson River dredging project) ($0.6 billion) were partially
offset by lower gains related to disposed businesses ($0.2 billion).
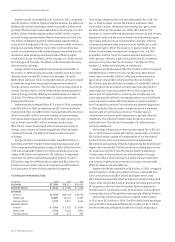
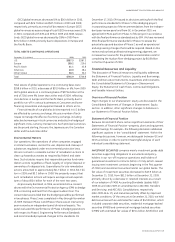
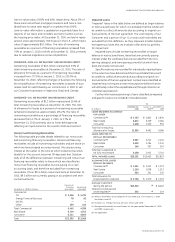
DISCONTINUED OPERATIONS
(In millions) 2010 2009 2008
Earnings (loss) from discontinued
operations, net of taxes $(979) $82 $(617)
Discontinued operations primarily comprised BAC, GE Money
Japan, our U.S. mortgage business (WMC), Consumer RV Marine,
Consumer Mexico and Plastics. Results of these businesses are
reported as discontinued operations for all periods presented.
During the fourth quarter of 2010, we completed the sale of
our 100% interest in BAC for $1.9 billion. As a result, we recog-
nized an after-tax gain of $0.8 billion in 2010. The disposition of
BAC is consistent with our goal of reducing ENI and focusing our
businesses on selective financial services products where we
have domain knowledge, broad distribution, and the ability to
earn a consistent return on capital, while managing our overall
balance sheet size and risk.
In the fourth quarter of 2010, we entered into agreements to
sell Consumer RV Marine and Consumer Mexico for approximately
$2.4 billion and approximately $2.0 billion, respectively, and have
classified these businesses as discontinued operations.
During the third quarter of 2007, we committed to a plan to sell
our Lake business and recorded an after-tax loss of $0.9 billion,
which represented the difference between the net book value of
our Lake business and the projected sale price. During 2008, we
completed the sale of GE Money Japan, which included Lake,
along with our Japanese mortgage and card businesses, exclud-
ing our minority ownership interest in GE Nissen Credit Co., Ltd.
In connection with this sale, and primarily related to our Japanese
mortgage and card businesses, we recorded an incremental
$0.4 billion loss in 2008.
In 2010, loss from discontinued operations, net of taxes, pri-
marily reflected incremental reserves for excess interest claims
related to our loss-sharing arrangement on the 2008 sale of
GE Money Japan ($1.7 billion) and estimated after-tax losses
of $0.2 billion and $0.1 billion on the planned sales of Consumer
Mexico and Consumer RV Marine, respectively, partially offset by
an after-tax gain on the sale of BAC of $0.8 billion and earnings
from operations at Consumer Mexico of $0.2 billion and at BAC
of $0.1 billion.
Loss from discontinued operations, net of taxes, in 2009,
primarily reflected incremental reserves for excess interest claims
related to our loss-sharing arrangement on the 2008 sale of
GE Money Japan of $0.1 billion.
Loss from discontinued operations, net of taxes, in 2008 was
$0.6 billion, primarily reflecting a loss from operations of $0.3 bil-
lion, and incremental reserves for excess interest claims related
to our loss-sharing arrangement on the 2008 sale of GE Money
Japan of $0.4 billion.
For additional information related to discontinued operations,
see Note 2.
Geographic Operations
Our global activities span all geographic regions and primarily
encompass manufacturing for local and export markets, import
and sale of products produced in other regions, leasing of air-
craft, sourcing for our plants domiciled in other global regions
and provision of financial services within these regional econo-
mies. Thus, when countries or regions experience currency and/
or economic stress, we often have increased exposure to certain
risks, but also often have new profit opportunities. Potential
increased risks include, among other things, higher receivable
delinquencies and bad debts, delays or cancellations of sales
and orders principally related to power and aircraft equipment,
higher local currency financing costs and slowdown in estab-
lished financial services activities. New profit opportunities
include, among other things, more opportunities for lower cost
outsourcing, expansion of industrial and financial services activi-
ties through purchases of companies or assets at reduced
prices and lower U.S. debt financing costs.
Revenues are classified according to the region to which
products and services are sold. For purposes of this analysis, U.S.
is presented separately from the remainder of the Americas. We
classify certain operations that cannot meaningfully be associ-
ated with specific geographic areas as “Other Global” for
this purpose.
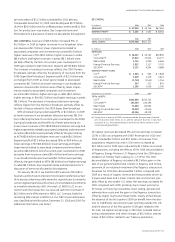
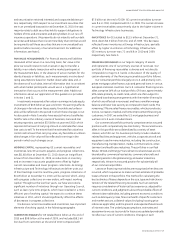
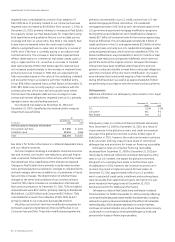
GEOGRAPHIC REVENUES
(In billions) 2010 2009 2008
U.S. $ 70.5 $ 72.2 $ 85.0
Europe 31.8 36.9 44.0
Pacific Basin 21.6 20.7 23.6
Americas 13.4 11.4 14.2
Middle East and Africa 9.1 10.0 10.1
Other Global 3.8 4.1 4.7
Total $150.2 $155.3 $181.6
Global revenues decreased 4% to $79.7 billion in 2010, com-
pared with $83.1 billion and $96.6 billion in 2009 and 2008,
respectively. Global revenues to external customers as a per-
centage of consolidated revenues were 53% in 2010, compared
with 54% in 2009 and 53% in 2008. The effects of currency
fluctuations on reported results increased revenues by $0.5 bil-
lion in 2010, decreased revenues by $3.9 billion in 2009 and
increased revenues by $2.0 billion in 2008.
GE global revenues, excluding GECS, in 2010 were $53.3 billion,
down 5% over 2009. Decreases of 12% in Europe and 9% in the
Middle East and Africa more than offset increases in growth
markets of 43% in Australia and 18% in Latin America. These
revenues as a percentage of GE total revenues, excluding GECS,
were 53% in 2010, compared with 55% and 53% in 2009 and
2008, respectively. GE global revenues, excluding GECS, were
$56.4 billion in 2009, down 5% from 2008, primarily resulting from
decreases in Western Europe and Latin America.