GE 2010 Annual Report Download - page 109
Download and view the complete annual report
Please find page 109 of the 2010 GE annual report below. You can navigate through the pages in the report by either clicking on the pages listed below, or by using the keyword search tool below to find specific information within the annual report.-
 1
1 -
2
-
3
-
4
-
5
-
6
-
7
-
8
-
9
-
10
-
11
-
12
-
13
-
14
-
15
-
16
-
17
-
18
-
19
-
20
-
21
-
22
-
23
-
24
-
25
-
26
-
27
-
28
-
29
-
30
-
31
-
32
-
33
-
34
-
35
-
36
-
37
-
38
-
39
-
40
-
41
-
42
-
43
-
44
-
45
-
46
-
47
-
48
-
49
-
50
-
51
-
52
-
53
-
54
-
55
-
56
-
57
-
58
-
59
-
60
-
61
-
62
-
63
-
64
-
65
-
66
-
67
-
68
-
69
-
70
-
71
-
72
-
73
-
74
-
75
-
76
-
77
-
78
-
79
-
80
-
81
-
82
-
83
-
84
-
85
-
86
-
87
-
88
-
89
-
90
-
91
-
92
-
93
-
94
-
95
-
96
-
97
-
98
-
 99
99 -
 100
100 -
 101
101 -
 102
102 -
 103
103 -
 104
104 -
 105
105 -
 106
106 -
 107
107 -
 108
108 -
 109
109 -
 110
110 -
 111
111 -
 112
112 -
 113
113 -
 114
114 -
 115
115 -
 116
116 -
 117
117 -
 118
118 -
 119
119 -
120
-
121
-
122
-
123
-
124
-
125
-
126
-
127
-
128
-
129
-
130
-
131
-
132
-
133
-
134
-
135
-
136
-
137
-
138
-
139
-
140
 |
 |

GE 2010 ANNUAL REPORT 107
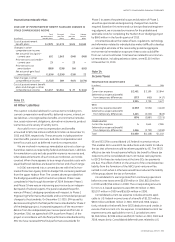
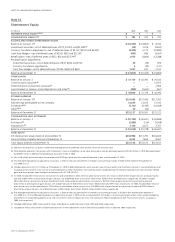
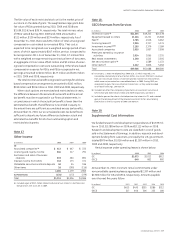
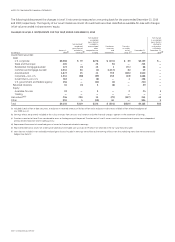
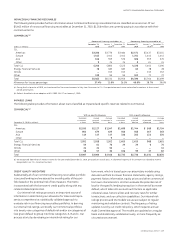
Note 18.
GECS Revenues from Services
(In millions) 2010 2009 2008
Interest on loans
(a) $21,344 $19,205 $26,378
Equipment leased to others 11,116 12,231 15,568
Fees (a) 4,785 4,516 6,062
Financing leases
(a) 2,805 3,317 4,374
Investment income
(a)(b) 2,185 3,379 2,189
Associated companies 2,035 1,007 2,058
Premiums earned by insurance
activities 2,014 2,065 2,255
Real estate investments 1,240 1,543 3,505
Net securitization gains
(a) — 1,589 1,133
Other items
(c) 2,442 2,836 5,058
Total $49,966 $51,688 $68,580
(a) On January 1, 2010, we adopted ASU 2009-16 & 17, which required us to
consolidate substantially all of our former QSPEs. As a result, 2010 GECS revenues
from services include interest, investment and fee income from these entities,
which were not presented on a consolidated basis in 2009. During 2010, we
recognized no gains from securitization transactions, as they were recorded
as on-book financings. See Note 24.
(b) Included net other-than-temporary impairments on investment securities of
$253 million and $581 million in 2010 and 2009, respectively. See Note 3.
(c) Included a gain on the sale of a limited partnership interest in PTL and a related
gain on the remeasurement of the retained investment to fair value totaling
$296 million in the first quarter of 2009. See Note 24.
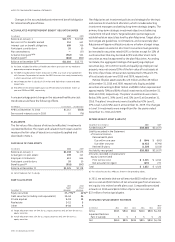
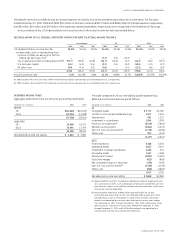
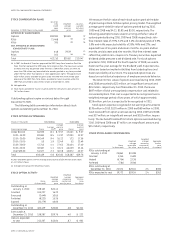
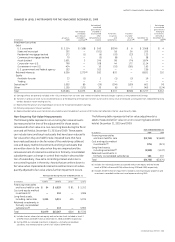
Note 19.
Supplemental Cost Information
We funded research and development expenditures of $3,939 mil-
lion in 2010, $3,288 million in 2009 and $3,113 million in 2008.
Research and development costs are classified in cost of goods
sold in the Statement of Earnings. In addition, research and devel-
opment funding from customers, principally the U.S. government,
totaled $979 million, $1,050 million and $1,287 million in 2010,
2009 and 2008, respectively.
Rental expense under operating leases is shown below.
(In millions) 2010 2009 2008
GE $1,073 $1,012 $912
GECS 640 802 992
At December 31, 2010, minimum rental commitments under
noncancellable operating leases aggregated $2,397 million and
$2,380 million for GE and GECS, respectively. Amounts payable
over the next five years follow.
(In millions) 2011 2012 2013 2014 2015
GE $613 $470 $355 $286 $212
GEC S 517 4 66 30 6 223 18 0
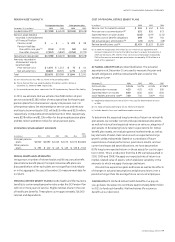
The fair value of each restricted stock unit is the market price of
our stock on the date of grant. The weighted average grant date
fair value of RSUs granted during 2010, 2009 and 2008 was
$15.89, $13.63 and $28.74, respectively. The total intrinsic value
of RSUs vested during 2010, 2009 and 2008 amounted to
$111 million, $139 million and $274 million, respectively. As of
December 31, 2010, there was $334 million of total unrecognized
compensation cost related to nonvested RSUs. That cost is
expected to be recognized over a weighted average period of two
years, of which approximately $147 million, pre tax, is expected to
be recognized in 2011. As of December 31, 2010, 0.7 million PSUs
with a weighted average remaining contractual term of two years,
an aggregate intrinsic value of $13 million and $2 million of unrec-
ognized compensation cost were outstanding. Other share-based
compensation expense for RSUs and PSUs recognized in net
earnings amounted to $116 million, $127 million and $155 million
in 2010, 2009 and 2008, respectively.
The total income tax benefit recognized in earnings for all share-
based compensation arrangements amounted to $143 million,
$118 million and $106 million in 2010, 2009 and 2008, respectively.
When stock options are exercised and restricted stock vests,
the difference between the assumed tax benefit and the actual
tax benefit must be recognized in our financial statements. In
circumstances in which the actual tax benefit is lower than the
estimated tax benefit, that difference is recorded in equity, to
the extent there are sufficient accumulated excess tax benefits.
At December 31, 2010, our accumulated excess tax benefits are
sufficient to absorb any future differences between actual and
estimated tax benefits for all of our outstanding option and
restricted stock grants.
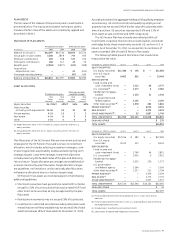
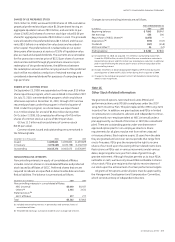
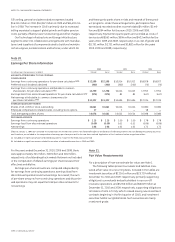
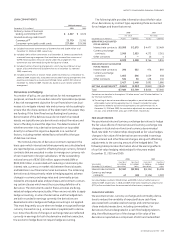
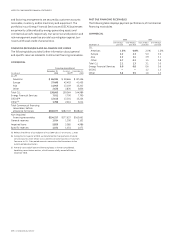
Note 17.
Other Income
(In millions) 2010 2009 2008
GE
Associated companies
(a) $ 413 $ 667 $ 332
Licensing and royalty income 364 217 291
Purchases and sales of business
interests 319 363 891
Interest income from GECS 133 173 371
Marketable securities and bank deposits 40 54 196
Other items 16 (295) (116)
1,285 1,179 1,965
ELIMINATIONS (134) (173) (379)
Total $1,151 $1,006 $1,586
(a) Included a gain of $552 million related to dilution of our interest in A&E Television
Network from 25% to 15.8% in 2009.