GE 2010 Annual Report Download - page 43
Download and view the complete annual report
Please find page 43 of the 2010 GE annual report below. You can navigate through the pages in the report by either clicking on the pages listed below, or by using the keyword search tool below to find specific information within the annual report.-
 1
1 -
2
-
3
-
4
-
5
-
6
-
7
-
8
-
9
-
10
-
11
-
12
-
13
-
14
-
15
-
16
-
17
-
18
-
19
-
20
-
21
-
22
-
23
-
24
-
25
-
26
-
27
-
28
-
29
-
30
-
31
-
32
-
 33
33 -
 34
34 -
 35
35 -
 36
36 -
 37
37 -
 38
38 -
 39
39 -
 40
40 -
 41
41 -
 42
42 -
 43
43 -
 44
44 -
 45
45 -
 46
46 -
 47
47 -
 48
48 -
 49
49 -
 50
50 -
 51
51 -
 52
52 -
 53
53 -
54
-
55
-
56
-
57
-
58
-
59
-
60
-
61
-
62
-
63
-
64
-
65
-
66
-
67
-
68
-
69
-
70
-
71
-
72
-
73
-
74
-
75
-
76
-
77
-
78
-
79
-
80
-
81
-
82
-
83
-
84
-
85
-
86
-
87
-
88
-
89
-
90
-
91
-
92
-
93
-
94
-
95
-
96
-
97
-
98
-
99
-
100
-
101
-
102
-
103
-
104
-
105
-
106
-
107
-
108
-
109
-
110
-
111
-
112
-
113
-
114
-
115
-
116
-
117
-
118
-
119
-
120
-
121
-
122
-
123
-
124
-
125
-
126
-
127
-
128
-
129
-
130
-
131
-
132
-
133
-
134
-
135
-
136
-
137
-
138
-
139
-
140
 |
 |

management’s discussion and analsis
GE 2010 ANNUAL REPORT 41
services orders of $11.7 billion scheduled for 2011 delivery.
Comparable December 31, 2009, total backlog was $37.9 billion,
of which $26.0 billion was for unfilled product orders and $11.9 bil-
lion, for product services orders. See Corporate Items and
Eliminations for a discussion of items not allocated to this segment.
NBC UNIVERSAL revenues of $16.9 billion increased 9%, or
$1.5 billion, in 2010 as higher revenues in our broadcast televi-
sion business ($0.7 billion), lower impairments related to
associated companies and investment securities ($0.5 billion),
higher revenues in film ($0.3 billion), higher revenues in cable
($0.4 billion) and higher revenues in parks ($0.2 billion) were
partially offset by the lack of a current year counterpart to a
2009 gain related to A&E Television Network (AETN) ($0.6 billion).
The increase in broadcast revenues reflects the 2010 Olympic
broadcasts, partially offset by the absence of revenues from the
2009 Super Bowl broadcast. Segment profit of $2.3 billion was
unchanged from 2009, as lower gains related to associated
companies ($0.7 billion) and lower earnings in our broadcast
television business ($0.3 billion) were offset by lower impair-
ments related to associated companies and investment
securities ($0.5 billion), higher earnings in cable ($0.3 billion),
higher earnings in film ($0.2 billion) and higher earnings in parks
($0.1 billion). The decrease in broadcast television earnings
reflects losses from the Olympics broadcast, partially offset by
the lack of losses related to the 2009 Super Bowl broadcast.
NBC Universal revenues decreased 9%, or $1.5 billion, in 2009
as lower revenues in our broadcast television business ($1.1 bil-
lion), reflecting the lack of a current-year counterpart to the 2008
Olympics broadcasts and the effects of lower advertising rev-
enues, lower revenues in film ($0.8 billion) and lower earnings and
higher impairments related to associated companies and investment
securities ($0.4 billion) were partially offset by the gain relating
to AETN ($0.6 billion) and higher revenues in cable ($0.3 billion).
Segment profit of $2.3 billion decreased 28%, or $0.9 billion, as
lower earnings in film ($0.6 billion), lower earnings and higher
impairments related to associated companies and investment
securities ($0.4 billion), lack of a current-year counterpart to 2008
proceeds from insurance claims ($0.4 billion) and lower earnings
in our broadcast television business ($0.2 billion) were partially
offset by the gain related to AETN ($0.6 billion) and higher earnings
in cable ($0.2 billion). See Corporate Items and Eliminations for a
discussion of items not allocated to this segment.
On January 28, 2011, we transferred the assets of the NBCU
business and Comcast Corporation (Comcast) transferred certain
of its assets comprising cable networks, regional sports networks,
certain digital properties and certain unconsolidated investments
to a newly formed entity, NBC Universal LLC (NBCU LLC). In con-
nection with the transaction, we received cash from Comcast of
$6.2 billion and a 49% interest in NBCU LLC. Comcast holds the
remaining 51% interest in NBCU LLC. Our NBC Universal business
was classified as held for sale at December 31, 2010 and 2009. For
additional information, see Note 2.
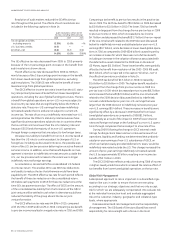
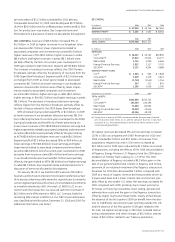
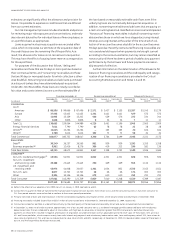
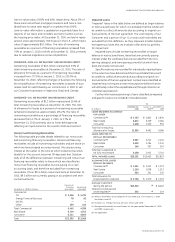
GE CAPITAL
(In millions) 2010 2009 2008
REVENUES $ 47,040 $ 49,746 $67,645
SEGMENT PROFIT $ 3,265 $ 1,462 $ 8,063
December 31 (In millions) 2010 2009
TOTAL ASSETS $575,908 $607,707
(In millions) 2010 2009 2008
REVENUES
CLL (a) $ 18,447 $ 20,762 $26,856
Consumer (a) 17,822 17,634 24,177
Real Estate 3,744 4,009 6,646
Energy Financial Services 1,957 2,117 3,707
GECAS (a) 5,127 4,594 4,688
SEGMENT PROFIT (LOSS)
CLL (a) $ 1,554 $ 963 $ 1,838
Consumer (a) 2,629 1,419 3,623
Real Estate (1,741) (1,541) 1,144
Energy Financial Services 367 212 825
GECAS (a) 1,195 1,016 1,140
December 31 (In millions) 2010 2009
TOTAL ASSETS
CLL (a) $202,650 $210,742
Consumer (a) 154,469 160,494
Real Estate 72,630 81,505
Energy Financial Services 19,549 22,616
GECAS (a) 49,106 48,178
(a) During the first quarter of 2010, we transferred the Transportation Financial
Services business from GECAS to CLL and the Consumer business in Italy from
Consumer to CLL. Prior-period amounts were reclassified to conform to the
current-period presentation.
GE Capital revenues decreased 5% and net earnings increased
123% in 2010 as compared with 2009. Revenues for 2010 and
2009 included $0.2 billion and $0.1 billion of revenues from
acquisitions, respectively, and in 2010 were increased by
$0.1 billion and in 2009 were reduced by $2.3 billion as a result
of dispositions, including the effects of the 2010 deconsolidation
of Regency Energy Partners L.P. (Regency) and the 2009 decon-
solidation of Penske Truck Leasing Co., L.P. (PTL). The 2010
deconsolidation of Regency included a $0.1 billion gain on the
sale of our general partnership interest in Regency and remea-
surement of our retained investment (the Regency transaction).
Revenues for 2010 also decreased $0.7 billion compared with
2009 as a result of organic revenue declines primarily driven by
a lower asset base and a lower interest rate environment, par-
tially offset by the weaker U.S. dollar. Net earnings increased for
2010 compared with 2009, primarily due to lower provisions
for losses on financing receivables, lower selling, general and
administrative costs and the gain on the Regency transaction,
offset by higher marks and impairments, mainly at Real Estate,
the absence of the first quarter 2009 tax benefit from the deci-
sion to indefinitely reinvest prior-year earnings outside the U.S.,
and the absence of the first quarter 2009 gain related to the
PTL sale. GE Capital net earnings in 2010 also included restruc-
turing, rationalization and other charges of $0.2 billion and net
losses of $0.1 billion related to our Treasury operations.