GE 2010 Annual Report Download - page 114
Download and view the complete annual report
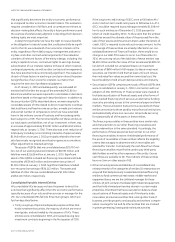
Please find page 114 of the 2010 GE annual report below. You can navigate through the pages in the report by either clicking on the pages listed below, or by using the keyword search tool below to find specific information within the annual report.-
 1
1 -
2
-
3
-
4
-
5
-
6
-
7
-
8
-
9
-
10
-
11
-
12
-
13
-
14
-
15
-
16
-
17
-
18
-
19
-
20
-
21
-
22
-
23
-
24
-
25
-
26
-
27
-
28
-
29
-
30
-
31
-
32
-
33
-
34
-
35
-
36
-
37
-
38
-
39
-
40
-
41
-
42
-
43
-
44
-
45
-
46
-
47
-
48
-
49
-
50
-
51
-
52
-
53
-
54
-
55
-
56
-
57
-
58
-
59
-
60
-
61
-
62
-
63
-
64
-
65
-
66
-
67
-
68
-
69
-
70
-
71
-
72
-
73
-
74
-
75
-
76
-
77
-
78
-
79
-
80
-
81
-
82
-
83
-
84
-
85
-
86
-
87
-
88
-
89
-
90
-
91
-
92
-
93
-
94
-
95
-
96
-
97
-
98
-
99
-
100
-
101
-
102
-
103
-
 104
104 -
 105
105 -
 106
106 -
 107
107 -
 108
108 -
 109
109 -
 110
110 -
 111
111 -
 112
112 -
 113
113 -
 114
114 -
 115
115 -
 116
116 -
 117
117 -
 118
118 -
 119
119 -
 120
120 -
 121
121 -
 122
122 -
 123
123 -
 124
124 -
125
-
126
-
127
-
128
-
129
-
130
-
131
-
132
-
133
-
134
-
135
-
136
-
137
-
138
-
139
-
140
 |
 |

112 GE 2010 ANNUAL REPORT
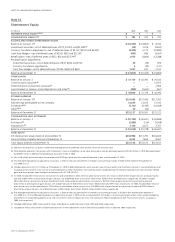
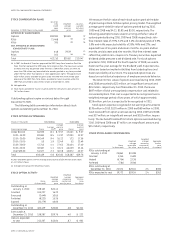
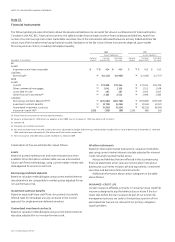
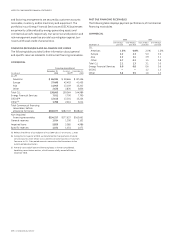
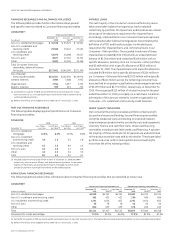
Note 22.
Financial Instruments
The following table provides information about the assets and liabilities not carried at fair value in our Statement of Financial Position.
Consistent with ASC 825, Financial Instruments, the table excludes finance leases and non-financial assets and liabilities. Apart from
certain of our borrowings and certain marketable securities, few of the instruments discussed below are actively traded and their fair
values must often be determined using financial models. Realization of the fair value of these instruments depends upon market
forces beyond our control, including marketplace liquidity.
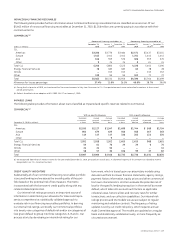
2010 2009
Assets (liabilities) Assets (liabilities)
Notional Carrying Estimated Notional Carrying Estimated
December 31 (In millions) amount amount (net) fair value amount amount (net) fair value
GE
Assets
Investments and notes receivable $
(a) $ 414 $ 414 $
(a) $ 412 $ 412
Liabilities
Borrowings(c) (a) (10,112) (10,953) (a) (12,185) (12,757)
GECS
Assets
Loans(b) (a) 273,969 270,344 (a) 273,263 259,799
Other commercial mortgages (a) 1,041 1,103 (a) 1,151 1,198
Loans held for sale (a) 287 287 (a) 1,303 1,343
Other financial instruments(d) (a) 2,103 2,511 (a) 2,096 2,385
Liabilities
Borrowings and bank deposits(b)(c)(e) (a) (470,562) (482,765) (a) (493,585) (499,409)
Investment contract benefits (a) (3,726) (4,264) (a) (3,940) (4,397)
Guaranteed investment contracts (a) (5,502) (5,524) (a) (8,310) (8,394)
Insurance—credit life(f) 1,825 (103) (69) 1,595 (80) (53)
(a) These financial instruments do not have notional amounts.
(b) Amounts at December 31, 2010 reflect our adoption of ASU 2009-16 & 17 on January 1, 2010. See Notes 6, 10, 23 and 24.
(c) See Note 10.
(d) Principally cost method investments.
(e) Fair values exclude interest rate and currency derivatives designated as hedges of borrowings. Had they been included, the fair value of borrowings at December 31, 2010 and
2009 would have been reduced by $4,298 million and $2,856 million, respectively.
(f) Net of reinsurance of $2,800 million at both December 31, 2010 and 2009.
All other instruments
Based on observable market transactions, valuation methodolo-
gies using current market interest rate data adjusted for inherent
credit risk and/or quoted market prices.
Assets and liabilities that are reflected in the accompanying
financial statements at fair value are not included in the above
disclosures; such items include cash and equivalents, investment
securities and derivative financial instruments.
Additional information about certain categories in the table
above follows.
INSURANCE—CREDIT LIFE
Certain insurance affiliates, primarily in Consumer, issue credit life
insurance designed to pay the balance due on a loan if the bor-
rower dies before the loan is repaid. As part of our overall risk
management process, we cede to third parties a portion of this
associated risk, but are not relieved of our primary obligation
to policyholders.
A description of how we estimate fair values follows.
Loans
Based on quoted market prices and recent transactions when
available. When this data is unobservable, we use a discounted
future cash flows methodology, using current market interest rate
data adjusted for inherent credit risk.
Borrowings and bank deposits
Based on valuation methodologies using current market interest
rate data which are comparable to market quotes adjusted for our
non-performance risk.
Investment contract benefits
Based on expected future cash flows, discounted at currently
offered rates for immediate annuity contracts or the income
approach for single premium deferred annuities.
Guaranteed investment contracts
Based on valuation methodologies using current market interest
rate data, adjusted for our non-performance risk.