EasyJet 2008 Annual Report Download - page 82
Download and view the complete annual report
Please find page 82 of the 2008 EasyJet annual report below. You can navigate through the pages in the report by either clicking on the pages listed below, or by using the keyword search tool below to find specific information within the annual report.-
 1
1 -
2
-
3
-
4
-
5
-
6
-
7
-
8
-
9
-
10
-
11
-
12
-
13
-
14
-
15
-
16
-
17
-
18
-
19
-
20
-
21
-
22
-
23
-
24
-
25
-
26
-
27
-
28
-
29
-
30
-
31
-
32
-
33
-
34
-
35
-
36
-
37
-
38
-
39
-
40
-
41
-
42
-
43
-
44
-
45
-
46
-
47
-
48
-
49
-
50
-
51
-
52
-
53
-
54
-
55
-
56
-
57
-
58
-
59
-
60
-
61
-
62
-
63
-
64
-
65
-
66
-
67
-
68
-
69
-
70
-
71
-
 72
72 -
 73
73 -
 74
74 -
 75
75 -
 76
76 -
 77
77 -
 78
78 -
 79
79 -
 80
80 -
 81
81 -
 82
82 -
 83
83 -
 84
84
 |
 |

2006
2008 2007 £million 2005 2004
£million £million (represented) £million £million
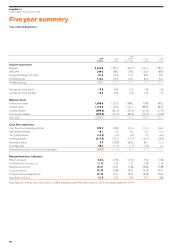
Income statement
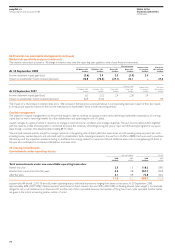
Revenue 2,362.8 1,797.2 1,619.7 1,341.4 1,091.0
EBITDAR 248.6 298.2 278.5 206.6 189.6
Group operating profit (EBIT) 91.0 172.0 117.7 66.2 50.5
Profit before tax 110.2 201.9 129.2 82.6 62.2
Profit for the year 83.2 152.3 94.1 59.0 41.1
Earnings per share (basic) 19.8 36.6 23.2 14.8 14.6
Earnings per share (diluted) 19.4 35.6 22.6 14.4 14.3
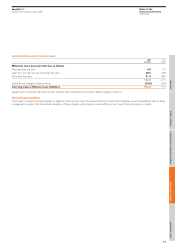
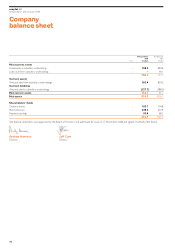
Balance sheet
Non-current assets 1,680.8 1,350.0 1,088.3 738.9 640.2
Current assets 1,415.0 1,166.4 1,101.1 890.9 684.7
Current liabilities (909.8) (621.3) (522.9) (414.5) (314.7)
Non-current liabilities (907.8) (742.7) (683.6) (351.9) (220.8)
Net assets 1,278.2 1,152.4 982.9 863.4 789.4
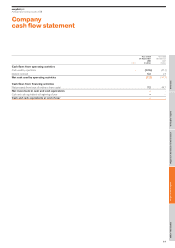
Cash flow statement
Cash flows from operating activities 292.3 260.8 221.6 221.0 160.5
Net interest received 18.1 12.0 8.1 23.1 12.6
Tax (paid)/received (14.2) (2.0) (4.5) 2.9 (6.2)
Investing activities (417.6) (272.1) (314.3) (162.7) (58.5)
Financing activities 5.9 (128.9) 284.5 87.1 71.3
Exchange rates 28.6 (11.4) (1.7) (0.4) n/a
(Decrease)/increase in cash and cash equivalents (86.9) (141.6) 193.7 171.0 179.7
Key performance indicators
Return on equity 6.8% 14.3% 10.1% 7.1% 5.3%
Profit before tax per seat (£) 2.12 4.54 3.32 2.38 2.16
Revenue per seat (£) 45.51 40.42 41.66 38.66 37.88
Cost per seat (£) 43.39 35.88 38.34 36.28 35.72
Cost per seat excluding fuel (£) 29.74 26.31 28.36 28.78 30.63
Seats flown (millions) 51.9 44.5 38.9 34.7 28.8
Information for the four years from 2005 to 2008 is presented under IFRS. Information for 2004 is presented under UK GAAP.
easyJet plc
Annual report and accounts 2008
Five year summary
Year end to 30 September
80