EasyJet 2008 Annual Report Download - page 20
Download and view the complete annual report
Please find page 20 of the 2008 EasyJet annual report below. You can navigate through the pages in the report by either clicking on the pages listed below, or by using the keyword search tool below to find specific information within the annual report.-
 1
1 -
2
-
3
-
4
-
5
-
6
-
7
-
8
-
9
-
 10
10 -
 11
11 -
 12
12 -
 13
13 -
 14
14 -
 15
15 -
 16
16 -
 17
17 -
 18
18 -
 19
19 -
 20
20 -
 21
21 -
 22
22 -
 23
23 -
 24
24 -
 25
25 -
 26
26 -
 27
27 -
 28
28 -
 29
29 -
 30
30 -
31
-
32
-
33
-
34
-
35
-
36
-
37
-
38
-
39
-
40
-
41
-
42
-
43
-
44
-
45
-
46
-
47
-
48
-
49
-
50
-
51
-
52
-
53
-
54
-
55
-
56
-
57
-
58
-
59
-
60
-
61
-
62
-
63
-
64
-
65
-
66
-
67
-
68
-
69
-
70
-
71
-
72
-
73
-
74
-
75
-
76
-
77
-
78
-
79
-
80
-
81
-
82
-
83
-
84
 |
 |
easyJet plc
Annual report and accounts 2008
Corporate and
social responsibility
continued
2. easyJet strives to be efficient on the ground
A. Short dwell time on ramp – quick turns
easyJet’s business model is designed to achieve high aircraft utilisation.
Key to this is minimising the turnaround time (measured as the time
between the aircraft arriving at the gate and pushing back for departure).
easyJet’s benchmark turnaround time is 25 minutes and, where possible,
easyJet turn the aircraft around in 20 minutes. During a turnaround, the
crew secure and prepare the aircraft for the next flight before boarding
passengers and their baggage. This process includes safety checks,
cleaning the aircraft cabin and on most occasions refuelling. By operating
to this standard, to service the same number of passengers through the
day, easyJet requires fewer gates and other airport infrastructure than
full service airlines.
B. Minimal use of ground equipment
easyJet’s policy is to use the most efficient and simple ground equipment
in order to facilitate reduced turnaround times. As such, easyJet prefers,
where possible, not to use air bridges. easyJet also prefers not to use
motorised steps.
C. Simple airport infrastructure
easyJet has simple airport infrastructure requirements. As a short-haul
point to point airline with one class of service and no cargo offering,
easyJet has no need for segregated check-in areas or for complex
baggage handling systems and facilities to transfer passengers between
flights. Wherever possible, easyJet works with airports to adapt and
develop existing facilities efficiently to minimise airport capital expenditure,
and reduce environmental impact. easyJet encourages its passengers
travelling with hand luggage only to use the online check-in product,
which helps reduce the need for expensive airport infrastructure.
D. easyJet keep surface journeys to a minimum
easyJet prefers to use local, convenient airports connected to good
public transport links. As part of its airport selection process, easyJet
assesses the convenience of an airport with respect to surface
transport options, with the aim of reducing the overall emissions
from passenger journeys.
E. Minimal waste
easyJet’s no frills service is designed to reduce waste in all areas.
easyJet is a ticketless airline and also has a policy of operating a near
paperless office, where the majority of paper documents are scanned
into a document management system. All paper is disposed of through
easyJet’s recycling programme, which includes confidential and
non-confidential paper streams. This programme includes printer
toner cartridges. Paper sent for recycling represented 15% of all
waste by weight generated by head office activities.
By not offering free food, easyJet eliminates meals that people do not
want and easyJet’s onboard product policy of generally supplying food
that does not rapidly perish minimises onboard waste. At present, the
small volume of food waste contained within easyJet’s onboard waste
generally means it cannot be accepted for recycling. easyJet also has
a programme to collect paper waste separately so that it can be sent
for recycling at as many airports as possible.
easyJet prefers to avoid the largest, most congested hub airports. easyJet
does not fly to Heathrow or to Frankfurt Main. It should be noted that
easyJet’s network is very different to that of a conventional “hub and
spoke” carrier. easyJet has no hubs but places capacity at the airports
that local demand requires. easyJet therefore has 20 local crew and
aircraft bases in six countries.
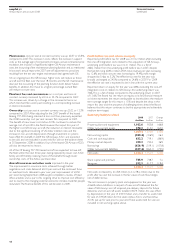
C. Comparison with other transport options
Many of easyJet’s passengers are using easyJet to fly to specific destinations.
A proportion of easyJet’s passengers have a choice of holiday destination.
Where they choose to fly can have a significant impact on their emissions.
In making this choice, length of flight is the major determinant of the
total emissions produced per passenger. easyJet’s average length of flight
in 2008 was 1,073 kilometres (up from 978 kilometres in 2007),
including the effect of the acquisition of GB Airways.
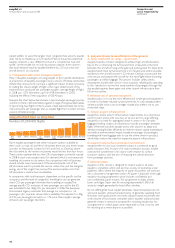
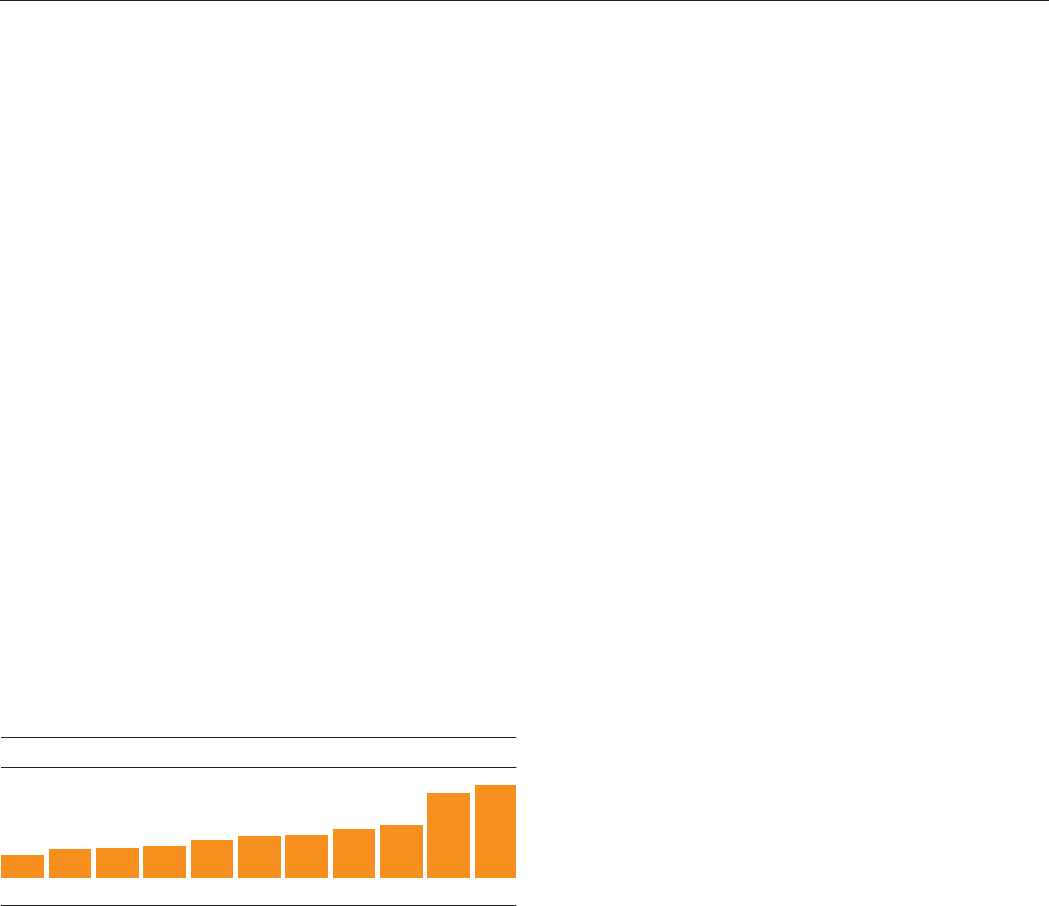
Example: the chart below benchmarks a typical easyJet passenger journey
(London to Nice, 1,050 kilometres) against a range of long-haul alternatives.
A typical long-haul flight to Miami would create approximately ten times
more emissions per passenger than an easyJet flight from London to Nice.
(source: climatecare.org).
Some easyJet passengers have other transport options available to
them (such as road, rail and ferry). However, there are only three routes
(London to Newcastle, London to Paris and Paris to Geneva) where
the city-centre to city-centre rail journey would be less than four hours.
These routes represented less than 2% of passengers carried by easyJet
in 2008. In each case, easyJet caters for demand which is not necessarily
travelling city-centre to city-centre. Any comparison with rail journeys
should include some assessment of the environmental cost of the
infrastructure used to provide the service, rather than just the marginal
energy use of the single train journey. The environmental cost of rail
infrastructure is unclear, but considerable.
In comparison with road transport, dependent on the specific car, the
occupancy and the level of congestion, travelling by car can generate
more CO2per passenger kilometre than travelling on easyJet. The
average specific CO2emissions of new passenger cars sold in the EU
was estimated to be 160g CO2per kilometre in 2006. The European
Environment Agency estimates that average car occupancy is 1.6
passengers (for countries where data is available). This equates to 100g
of CO2per passenger kilometre, or 11% more than easyJet’s average
emissions per passenger kilometre.
18
easyJet short haul vs long haul
Number of LON-NCE flights
7.7
New
York
Delhi Miami Vancouver Los
Angeles
Bangkok Cape
Town
Singapore Honolulu Sydney Auckland
9.4 10 10.7 12.6 13.9 14.1 16.2 17.5
28.1 31.0