EasyJet 2008 Annual Report Download - page 71
Download and view the complete annual report
Please find page 71 of the 2008 EasyJet annual report below. You can navigate through the pages in the report by either clicking on the pages listed below, or by using the keyword search tool below to find specific information within the annual report.-
 1
1 -
2
-
3
-
4
-
5
-
6
-
7
-
8
-
9
-
10
-
11
-
12
-
13
-
14
-
15
-
16
-
17
-
18
-
19
-
20
-
21
-
22
-
23
-
24
-
25
-
26
-
27
-
28
-
29
-
30
-
31
-
32
-
33
-
34
-
35
-
36
-
37
-
38
-
39
-
40
-
41
-
42
-
43
-
44
-
45
-
46
-
47
-
48
-
49
-
50
-
51
-
52
-
53
-
54
-
55
-
56
-
57
-
58
-
59
-
60
-
 61
61 -
 62
62 -
 63
63 -
 64
64 -
 65
65 -
 66
66 -
 67
67 -
 68
68 -
 69
69 -
 70
70 -
 71
71 -
 72
72 -
 73
73 -
 74
74 -
 75
75 -
 76
76 -
 77
77 -
 78
78 -
 79
79 -
 80
80 -
 81
81 -
82
-
83
-
84
 |
 |

easyJet plc
Annual report and accounts 2008
Notes to the
financial statements
continued
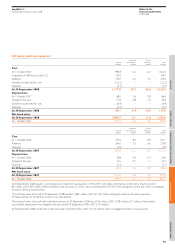
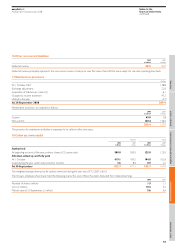
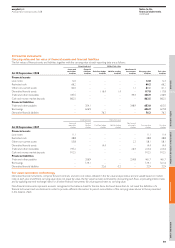
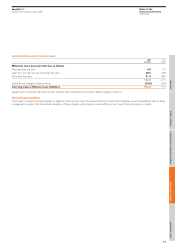
23 Financial instruments
Carrying value and fair value of financial assets and financial liabilities
The fair values of financial assets and liabilities, together with the carrying value at each reporting date are as follows:
Amortised cost Held at fair value
Loans and Financial Non-financial
receivables liabilities Cash flow hedge Held for trading instruments Carrying value Fair value
At 30 September 2008 £million £million £million £million £million £million £million
Financial assets
Loan notes 12.0––––12.0 12.3
Restricted cash 66.2––––66.2 66.2
Other non-current assets 60.0–––1.161.1 61.1
Derivative financial assets – – 116.4 1.4 – 117.8 117.8
Trade and other receivables 187.5–––49.4 236.9 236.9
Cash and money market deposits 862.5––––862.5 862.5
Financial liabilities
Trade and other payables – 304.1 – – 348.9 653.0 653.0
Borrowings – 626.9–––626.9 627.8
Derivative financial liabilities – – 76.3 – – 76.3 76.3
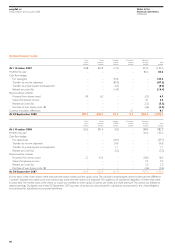
Amortised cost Held at fair value
Loans and Financial Non-financial
receivables liabilities Cash flow hedge Held for trading instruments Carrying value Fair value
At 30 September 2007 £million £million £million £million £million £million £million
Financial assets
Loan notes 11.1––––11.1 11.4
Restricted cash 48.8––––48.8 48.8
Other non-current assets 55.8–––2.358.1 58.1
Derivative financial assets – – 14.4 – – 14.4 14.4
Trade and other receivables 197.2–––26.4 223.6 223.6
Cash and money market deposits 912.5––––912.5 912.5
Financial liabilities
Trade and other payables – 206.9 – – 254.8 461.7 461.7
Borrowings – 519.1–––519.1 521.6
Derivative financial liabilities – – 32.6 0.3 – 32.9 32.9
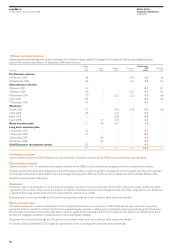
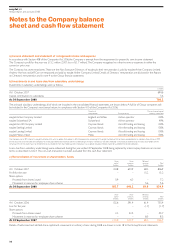
Fair value calculation methodology
Derivative financial instruments comprise forward contracts and zero cost collars, detailed in the fair value analysis below, and are valued based on market
rates at each year end. Where carrying value does not equal fair value, the fair value has been estimated by discounting cash flows at prevailing interest rates
and by applying year end exchange rates. For all other financial instruments fair value approximates to carrying value.
Non-financial instruments represent amounts recognised in the balance sheet for the line items disclosed above that do not meet the definition of a
financial instrument and are disclosed in order to provide sufficient information to permit reconciliation of the carrying values above to those presented
in the balance sheet.
69
OverviewDirectors’ reportReport on Directors’ remunerationFinancial informationOther information