EasyJet 2008 Annual Report Download - page 11
Download and view the complete annual report
Please find page 11 of the 2008 EasyJet annual report below. You can navigate through the pages in the report by either clicking on the pages listed below, or by using the keyword search tool below to find specific information within the annual report.-
 1
1 -
 2
2 -
 3
3 -
 4
4 -
 5
5 -
 6
6 -
 7
7 -
 8
8 -
 9
9 -
 10
10 -
 11
11 -
 12
12 -
 13
13 -
 14
14 -
 15
15 -
 16
16 -
 17
17 -
 18
18 -
 19
19 -
 20
20 -
 21
21 -
 22
22 -
23
-
24
-
25
-
26
-
27
-
28
-
29
-
30
-
31
-
32
-
33
-
34
-
35
-
36
-
37
-
38
-
39
-
40
-
41
-
42
-
43
-
44
-
45
-
46
-
47
-
48
-
49
-
50
-
51
-
52
-
53
-
54
-
55
-
56
-
57
-
58
-
59
-
60
-
61
-
62
-
63
-
64
-
65
-
66
-
67
-
68
-
69
-
70
-
71
-
72
-
73
-
74
-
75
-
76
-
77
-
78
-
79
-
80
-
81
-
82
-
83
-
84
 |
 |
easyJet plc
Annual report and accounts 2008
Financial review
OverviewDirectors’ reportReport on Directors’ remunerationFinancial informationOther information
09
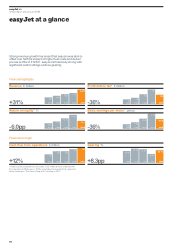
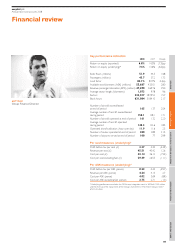
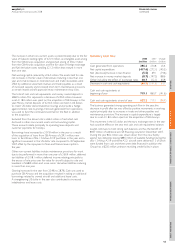
Key performance indicators
2008 2007 Change
Return on equity (reported) 6.8% 14.3% (7.5)pp
Return on equity (underlying)* 7.6% 13.6% (6.0)pp
Seats flown (millions) 51.9 44.5 16.8
Passengers (millions) 43.7 37.2 17.3
Load factor 84.1% 83.7% 0.4pp
Available seat kilometres (ASK) (millions) 55,687 43,501 28.0
Revenue passenger kilometres (RPK) (millions) 47,690 36,976 29.0
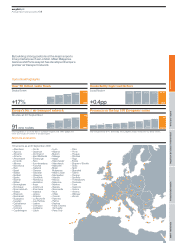
Average sector length (kilometres) 1,073 978 9.6
Sectors 333,017 287,952 15.7
Block hours 631,084 518,410 21.7
Number of aircraft owned/leased
at end of period 165 137 20.4
Average number of aircraft owned/leased
during period 150.1 128.1 17.1
Number of aircraft operated at end of period 161 132 22.0
Average number of aircraft operated
during period 145.3 122.6 18.5
Operated aircraft utilisation (hours per day) 11.9 11.6 2.5
Number of routes operated at end of period 380 289 31.5
Number of airports served at end of period 100 77 29.9
Per seat measures (underlying)*
Profit before tax per seat (£) 2.37 4.30 (44.9)
Revenue per seat (£) 45.51 40.42 12.6
Cost per seat (£) 43.14 36.12 (19.4)
Cost per seat excluding fuel (£) 29.49 26.55 (11.1)
Per ASK measures (underlying)*
Profit before tax per ASK (pence) 0.22 0.44 (49.7)
Revenue per ASK (pence) 4.24 4.13 2.7
Cost per ASK (pence) 4.02 3.69 (8.9)
Cost per ASK excluding fuel (pence) 2.75 2.71 (1.3)
*Underlying performance excludes the GB Airways integration costs in 2008 of £12.9 million
and the reversal of the impairment of the Group’s investment in The Airline Group in 2007
of £10.6 million.
Jeff Carr
Group Finance Director