EasyJet 2008 Annual Report Download - page 12
Download and view the complete annual report
Please find page 12 of the 2008 EasyJet annual report below. You can navigate through the pages in the report by either clicking on the pages listed below, or by using the keyword search tool below to find specific information within the annual report.-
 1
1 -
 2
2 -
 3
3 -
 4
4 -
 5
5 -
 6
6 -
 7
7 -
 8
8 -
 9
9 -
 10
10 -
 11
11 -
 12
12 -
 13
13 -
 14
14 -
 15
15 -
 16
16 -
 17
17 -
 18
18 -
 19
19 -
 20
20 -
 21
21 -
 22
22 -
23
-
24
-
25
-
26
-
27
-
28
-
29
-
30
-
31
-
32
-
33
-
34
-
35
-
36
-
37
-
38
-
39
-
40
-
41
-
42
-
43
-
44
-
45
-
46
-
47
-
48
-
49
-
50
-
51
-
52
-
53
-
54
-
55
-
56
-
57
-
58
-
59
-
60
-
61
-
62
-
63
-
64
-
65
-
66
-
67
-
68
-
69
-
70
-
71
-
72
-
73
-
74
-
75
-
76
-
77
-
78
-
79
-
80
-
81
-
82
-
83
-
84
 |
 |

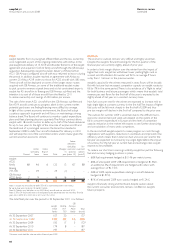
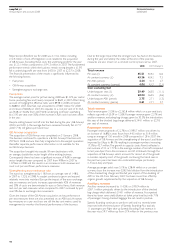
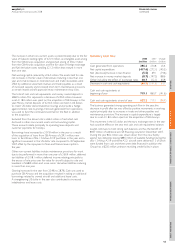
Due to the large impact that the stronger euro has had on the business
during the year and latterly the dollar at the end of the year, key
measures are also shown on a constant currency basis versus 2007.
2008 2007 Change %
Total revenue
Per seat (£) 45.51 40.42 12.6
At constant currency (£) 43.36 40.42 7.3
Per ASK (pence) 4.24 4.13 2.7
At constant currency (pence) 4.04 4.13 (2.1)
Cost excluding fuel
Underlying per seat (£) 29.49 26.55 (11.1)
At constant currency (£) 28.04 26.55 (5.6)
Underlying per ASK (pence) 2.75 2.71 (1.3)
At constant currency (pence) 2.61 2.71 3.7
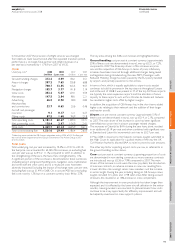
Total revenue
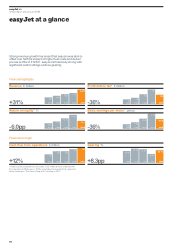
Total revenue grew 31.5% to £2,362.8 million which, on a per seat basis,
reflects a growth of £5.09 or 12.6%. Passenger revenue grew 22.7% and
ancillary revenue, excluding bag charges, grew by 30.3%; the introduction,
this year, of the checked bag charge delivered £144.1 million, or £2.76
per seat, of revenue.
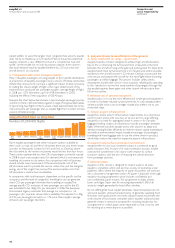
Passenger revenue
Passenger revenue growth of 22.7% to £1,995.7 million was driven by
an increase of 16.8% in seats flown from 44.5 million to 51.9 million
using an average of 150 aircraft in 2008 compared to 128 in 2007, the
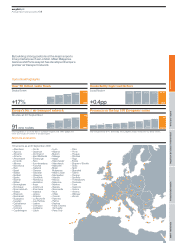
acquisition of GB Airways and the strengthening of the euro. Load factor
improved by 0.4pp to 84.1% resulting in passenger numbers increasing
17.3% to 43.7 million. The growth in capacity (seats flown) reflected a
net increase of 22, or 17.1%, in the average number of aircraft compared
to last year. Apart from the increase in aircraft at Gatwick through the
acquisition of GB Airways, which accounts for almost all of the growth
in London capacity, most of the growth, continuing the trend seen in
the past two years, has been into continental Europe, particularly
in France, Italy and Spain.
Average passenger yields rose 5.1% to £38.44 whilst on a constant
currency basis the increase was 0.5%. Yield dilution from the introduction
of the checked bag charge and the full year impact of the doubling of
APD in the UK, from February 2007, has been more than offset by
organic growth supplemented by the acquisition of GB Airways.
Ancillary revenue
Ancillary revenue increased by 114.5%, or £195.9 million to
£367.1 million principally driven by the introduction of the checked
bag charge which delivered £144.1 million of revenue. As expected
there has been some yield dilution at ticket price level but with 71%
of passengers having checked baggage the net result is positive.
Speedy Boarding continues to perform well and has recently been
improved with the introduction of Speedy Boarding Plus; typically
11 passengers per flight take up Speedy Boarding. Total revenue in
the year was £19.7 million up from £7.9 million in the previous year.
easyJet plc
Annual report and accounts 2008
Financial review
continued
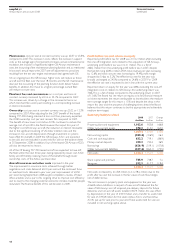
Reported profit before tax for 2008 was £110.2 million including
£12.9 million of one-off integration costs related to the acquisition
of GB Airways. Excluding these costs the underlying profit for the year
was £123.1 million compared to £191.3 million in 2007. The fundamental
performance trends within the business remain strong despite a £1.93
fall in underlying profit per seat from £4.30 in 2007 to £2.37 in 2008.
The financial presentation of the results is significantly influenced by
the following factors:
• Fuel prices;
• GB Airways acquisition;
• Strengthening euro exchange rate.
Fuel prices
The average market price for jet fuel during 2008 was $1,070 per metric
tonne (excluding fees and taxes) compared to $643 in 2007. After taking
account of hedging the effective rates were $948 in 2008 compared
to $688 in 2007. Total fuel cost amounted to £708.7 million for 2008
an increase of 66.6% on 2007; this equates to a cost per seat of £13.65,
up £4.08, or 42.6%, from 2007. With underlying profit per seat falling
by £1.93 per seat over 50% of the increase in fuel costs has been offset
in the year.
Despite adding heavier aircraft into the fleet during the year (GB Airways’
A320s and A321s) the average fuel burn remained broadly flat at 717
(2007: 716) US gallons per block hour.
GB Airways acquisition
The acquisition of GB Airways was completed on 31 January 2008.
The business continued to operate as a British Airways franchise until
29 March 2008 and was then fully integrated into the easyJet operation;
thereafter separate performance information is not available for the
ex GB Airways business.
The acquisition brought into easyJet 18 new destinations with,
on average, double the sector length of the existing business.
Consequently there has been a significant increase of 9.6% in average
sector length this year compared to 2007 from 978km in 2007 to
1,073km in 2008 and this results in an increase in both revenue and
most cost per seat flown performance measures.
Strengthening euro exchange rate
The euro has strengthened by 11% from an average rate of 1.48/£
in 2007 to 1.32/£ in 2008. As easyJet continues to grow and expand
relatively more into mainland Europe the impact of the euro exchange
rate on revenues and costs increases; approximately 42% of revenues
and 30% of costs are denominated in euro or Swiss francs. Both revenue
and cost per seat measures, when compared to 2007, increased by just
over 5% due to exchange rate movements.
Given the impact of the GB Airways acquisition on key performance
per seat measures these are also presented on an ASK basis. However,
key measures on a per seat basis are still the key unit metrics used by
management to monitor the financial performance of the business.
10