EasyJet 2008 Annual Report Download - page 13
Download and view the complete annual report
Please find page 13 of the 2008 EasyJet annual report below. You can navigate through the pages in the report by either clicking on the pages listed below, or by using the keyword search tool below to find specific information within the annual report.-
 1
1 -
2
-
 3
3 -
 4
4 -
 5
5 -
 6
6 -
 7
7 -
 8
8 -
 9
9 -
 10
10 -
 11
11 -
 12
12 -
 13
13 -
 14
14 -
 15
15 -
 16
16 -
 17
17 -
 18
18 -
 19
19 -
 20
20 -
 21
21 -
 22
22 -
 23
23 -
24
-
25
-
26
-
27
-
28
-
29
-
30
-
31
-
32
-
33
-
34
-
35
-
36
-
37
-
38
-
39
-
40
-
41
-
42
-
43
-
44
-
45
-
46
-
47
-
48
-
49
-
50
-
51
-
52
-
53
-
54
-
55
-
56
-
57
-
58
-
59
-
60
-
61
-
62
-
63
-
64
-
65
-
66
-
67
-
68
-
69
-
70
-
71
-
72
-
73
-
74
-
75
-
76
-
77
-
78
-
79
-
80
-
81
-
82
-
83
-
84
 |
 |
easyJet plc
Annual report and accounts 2008
Financial review
continued
The key areas driving the 5.6% cost increase are highlighted below:
Ground handling cost per seat at constant currency (approximately
55% of these costs are denominated in euro), was up £0.25, or 7.2%,
compared to 2007. The three key drivers of this increase are price,
mix and the acquisition of GB Airways. In terms of price, inflationary
increases have been incurred through additional charges being levied
and legislation being introduced e.g. the new PRM (Passengers with
Reduced Mobility) charge has been passed by the EU, poorly handled
by airports and partially passed on to the airlines.
In terms of mix, which is equally applicable to airport costs, easyJet
continues to build its presence in the top airports throughout Europe
and at the end of 2008 it was present in 37 of the top 50. These airports
are typically the more expensive airports and the allocation of more
capacity to these airports, such as Paris Charles de Gaulle and Gatwick,
has resulted in higher costs offset by higher margins.
In addition, the acquisition of GB Airways has, in the short term, added
higher costs relating to their network and the addition of their larger
and heavier aircraft.
Airport cost per seat at constant currency (approximately 51% of
these costs are denominated in euro), was up £0.14, or 2.1%, compared
to 2007. The main driver of the increase in costs has been significant
over-inflationary price rises in airport passenger related charges.
The increases at Gatwick by BAA during the year have, alone, resulted
in an additional £0.19 per seat and when combined with significant rises
at Stansted and Luton this incremental cost rises to £0.37 per seat.
In May 2008, in response to the Gatwick increases, easyJet submitted to
the High Court its application for a judicial review of the way the UK
Civil Aviation Authority allowed BAA to raise its prices by such amounts.
The other key factor impacting airport costs was mix, as referred to in
the ground handling section above.
Crew cost per seat at constant currency (a growing proportion of costs
are denominated in non-sterling currencies as more overseas contracts
are introduced) was up £0.36 or 7.9% compared to 2007. The main
drivers of the increase in costs were the crew pay deals, the introduction
of overseas contracts, an adverse increase in crew mix resulting from
a lower attrition rate amongst senior crew members and the increase
in sector length. During the year, including taking on GB Airways crews,
easyJet recruited 315 pilots and 1,198 cabin crew. After taking account
of leavers, this resulted in an 18% increase in crew complement.
Although the improvement in crew productivity has taken longer than
expected, and it is affected by the lower aircraft utilisation in the winter
months, crewing numbers are now back to planned levels. Crew costs
continue to be a key opportunity for efficiency improvement and will
be helped by investment in crew support systems.
In November 2007 the provision of inflight services was changed
from Alpha to Gate Gourmet and, after the expected transition period,
performance is on target. Total partner and inflight revenue, on a
per seat basis, increased by 11.7% from 2007 to £4.30.
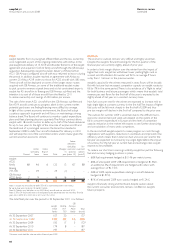
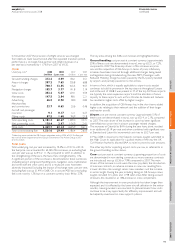
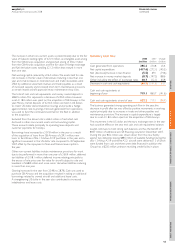
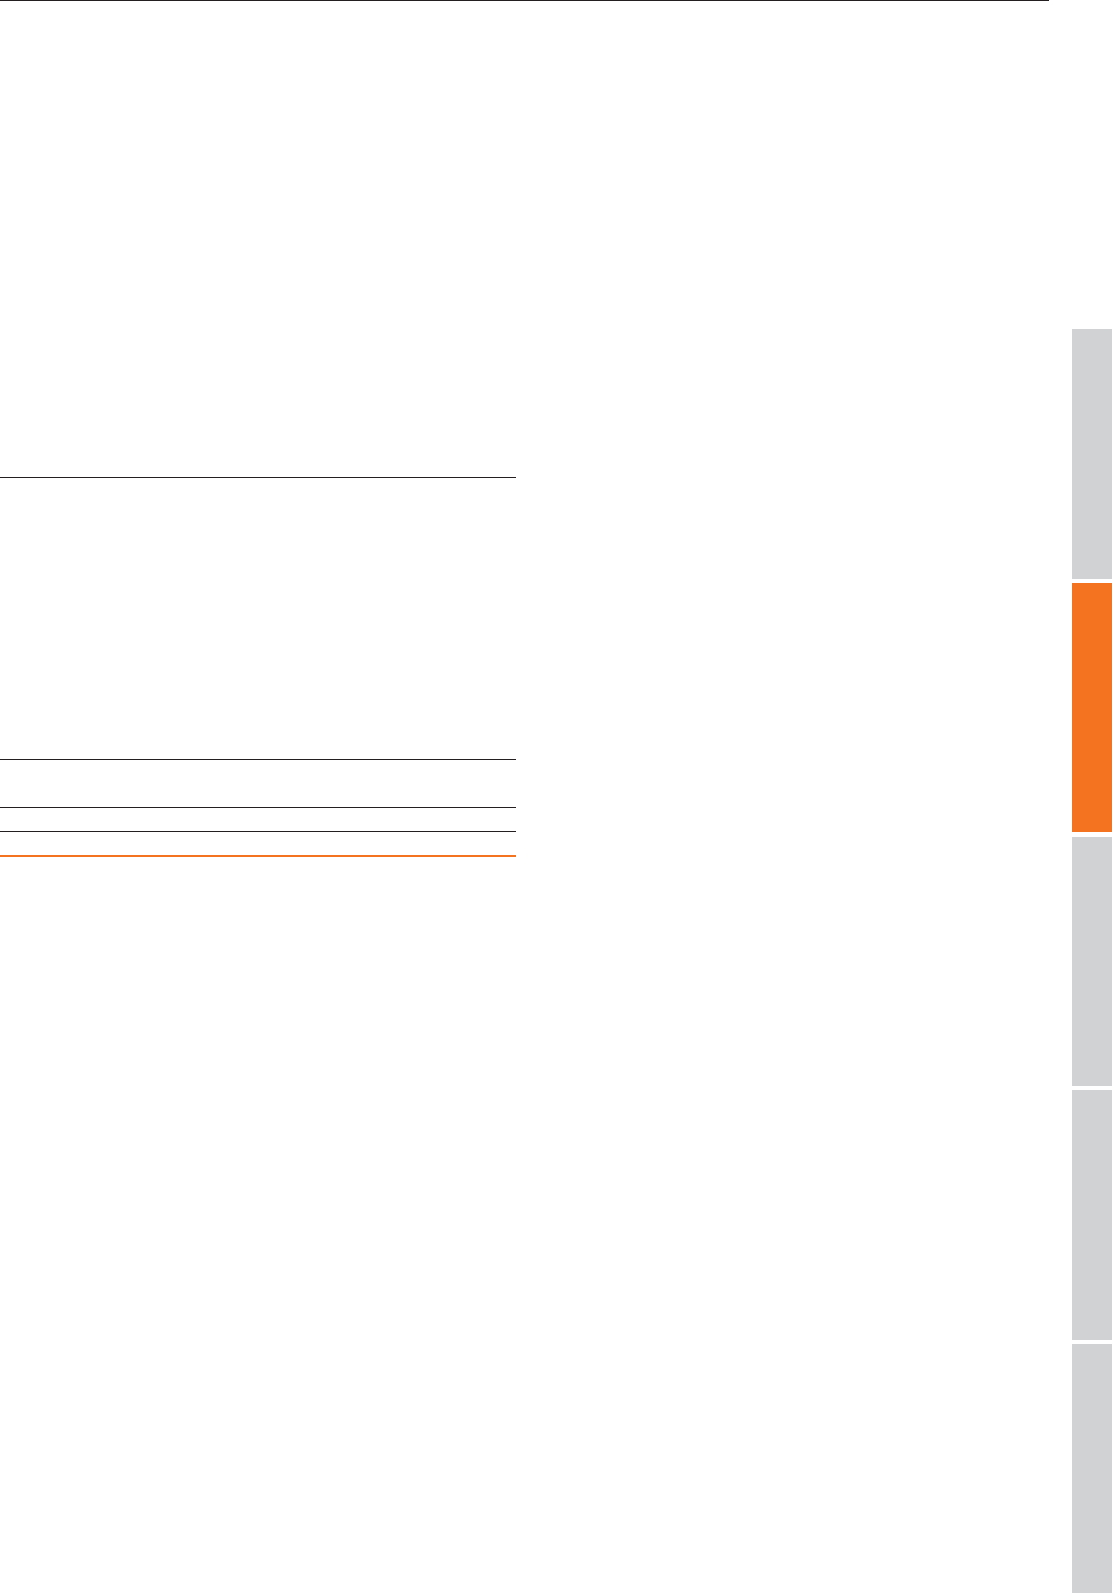
Costs
Underlying costs* 2008 2008 2007 2007
£million £ per seat £million £ per seat
Ground handling charges 212.2 4.09 156.1 3.51
Airport charges 397.2 7.65 305.8 6.88
Fuel 708.7 13.65 425.5 9.57
Navigation charges 195.7 3.77 141.8 3.19
Crew costs 263.2 5.07 204.1 4.59
Maintenance 147.5 2.84 98.1 2.21
Advertising 46.5 0.90 38.0 0.85
Merchant fees
and commissions 33.7 0.65 20.6 0.46
Aircraft and passenger
insurance 9.1 0.17 12.1 0.27
Other costs 87.5 1.68 96.9 2.18
Total operating costs 2,101.3 40.47 1,499.0 33.71
Net ownership costs 138.4 2.67 106.9 2.41
Total costs 2,239.7 43.14 1,605.9 36.12
Total costs excluding fuel 1,531.0 29.49 1,180.4 26.55
*Underlying costs exclude the GB Airways integration costs in 2008 of £12.9 million and
the reversal of the impairment of the Group’s investment in The Airline Group in 2007
of £10.6 million.
Total costs
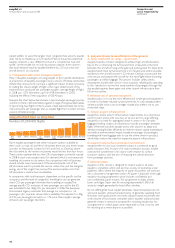
Total underlying cost per seat increased by 19.4% or £7.02 to £43.14;
the fuel price rise accounted for £4.08 of this increase, so excluding fuel
cost per seat was up £2.94 or 11.1% compared to 2007. In addition to
the strengthening of the euro, the Swiss franc strengthened by 11%.
A significant portion of the cost base is denominated in these currencies
(including airport and ground handling costs, navigation costs, maintenance
and some staff and crew costs) and as a result, unit costs have been
adversely impacted. Excluding the impact of exchange rates cost per seat,
excluding fuel, was up £1.49 or 5.6%. On a cost per ASK basis, excluding
fuel, costs rose by 1.3% but on a constant currency basis fell by 3.7%.
OverviewDirectors’ reportReport on Directors’ remunerationFinancial informationOther information
11