Dollar General 2006 Annual Report Download - page 94
Download and view the complete annual report
Please find page 94 of the 2006 Dollar General annual report below. You can navigate through the pages in the report by either clicking on the pages listed below, or by using the keyword search tool below to find specific information within the annual report.-
 1
1 -
2
-
3
-
4
-
5
-
6
-
7
-
8
-
9
-
10
-
11
-
12
-
13
-
14
-
15
-
16
-
17
-
18
-
19
-
20
-
21
-
22
-
23
-
24
-
25
-
26
-
27
-
28
-
29
-
30
-
31
-
32
-
33
-
34
-
35
-
36
-
37
-
38
-
39
-
40
-
41
-
42
-
43
-
44
-
45
-
46
-
47
-
48
-
49
-
50
-
51
-
52
-
53
-
54
-
55
-
56
-
57
-
58
-
59
-
60
-
61
-
62
-
63
-
64
-
65
-
66
-
67
-
68
-
69
-
70
-
71
-
72
-
73
-
74
-
75
-
76
-
77
-
78
-
79
-
80
-
81
-
82
-
83
-
 84
84 -
 85
85 -
 86
86 -
 87
87 -
 88
88 -
 89
89 -
 90
90 -
 91
91 -
 92
92 -
 93
93 -
 94
94 -
 95
95 -
 96
96 -
 97
97 -
 98
98 -
 99
99 -
 100
100 -
 101
101 -
 102
102 -
 103
103 -
 104
104 -
105
-
106
-
107
-
108
-
109
-
110
-
111
-
112
-
113
-
114
-
115
-
116
-
117
-
118
-
119
-
120
-
121
-
122
-
123
-
124
-
125
-
126
-
127
-
128
-
129
-
130
-
131
-
132
-
133
-
134
-
135
-
136
-
137
-
138
-
139
-
140
-
141
-
142
-
143
-
144
-
145
-
146
-
147
-
148
-
149
-
150
-
151
-
152
-
153
-
154
-
155
-
156
-
157
-
158
-
159
-
160
-
161
-
162
-
163
-
164
-
165
 |
 |

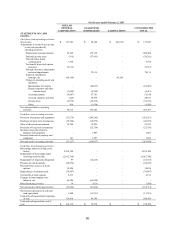
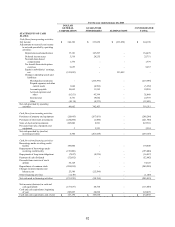
For the year ended January 28, 2005
DOLLAR
GENERAL
CORPORATION GUARANTOR
SUBSIDIARIES CONSOLIDATED
ELIMINATIONS TOTAL
STATEMENTS OF CASH
FLOWS:
Cash flows from operating activities:
Net income $344,190 $333,852 $(333,852) $344,190
Adjustments to reconcile net income
to net cash provided by operating
activities:
Depreciation and amortization 17,181 147,297 - 164,478
Deferred income taxes 5,516 20,235 - 25,751
Noncash share-based
compensation 1,779 - - 1,779
Tax benefit from stock option
exercises 9,657 - - 9,657
Equity in subsidiaries’ earnings,
net (333,852) - 333,852 -
Change in operating assets and
liabilities:
Merchandise inventories - (219,396) - (219,396)
Prepaid expenses and other
current assets 1,644 (4,996) - (3,352)
Accounts payable 10,665 11,593 - 22,258
Accrued expenses and
other (8,351) 43,399 - 35,048
Income taxes 4,751 19,042 - 23,793
Other (4,118) (8,573) - (12,691)
Net cash provided by operating
activities 49,062 342,453 -
391,515
Cash flows from investing activities:
Purchases of property and equipment (20,443) (267,851) - (288,294)
Purchases of short-term investments (220,200) (1,500) - (221,700)
Sales of short-term investments 245,000 2,501 - 247,501
Proceeds from sale of property and
equipment 3 3,321 - 3,324
Net cash provided by (used in)
investing activities 4,360 (263,529) - (259,169)
Cash flows from financing activities:
Borrowings under revolving credit
facility 195,000 - - 195,000
Repayments of borrowings under
revolving credit facility (195,000) - - (195,000)
Repayments of long-term obligations (7,847) (8,570) - (16,417)
Payment of cash dividends (52,682) - - (52,682)
Proceeds from exercise of stock
options 34,128 - - 34,128
Repurchases of common stock (209,295) - - (209,295)
Changes in intercompany note
balances, net 25,586 (25,586) - -
Other financing activities (1,149) - - (1,149)
Net cash used in financing activities (211,259) (34,156) - (245,415)
Net increase (decrease) in cash and
cash equivalents (157,837) 44,768 - (113,069)
Cash and cash equivalents, beginning
of year 285,007 60,892 - 345,899
Cash and cash equivalents, end of year $127,170 $105,660 $- $232,830
92