Dollar General 2006 Annual Report Download - page 132
Download and view the complete annual report
Please find page 132 of the 2006 Dollar General annual report below. You can navigate through the pages in the report by either clicking on the pages listed below, or by using the keyword search tool below to find specific information within the annual report.-
 1
1 -
2
-
3
-
4
-
5
-
6
-
7
-
8
-
9
-
10
-
11
-
12
-
13
-
14
-
15
-
16
-
17
-
18
-
19
-
20
-
21
-
22
-
23
-
24
-
25
-
26
-
27
-
28
-
29
-
30
-
31
-
32
-
33
-
34
-
35
-
36
-
37
-
38
-
39
-
40
-
41
-
42
-
43
-
44
-
45
-
46
-
47
-
48
-
49
-
50
-
51
-
52
-
53
-
54
-
55
-
56
-
57
-
58
-
59
-
60
-
61
-
62
-
63
-
64
-
65
-
66
-
67
-
68
-
69
-
70
-
71
-
72
-
73
-
74
-
75
-
76
-
77
-
78
-
79
-
80
-
81
-
82
-
83
-
84
-
85
-
86
-
87
-
88
-
89
-
90
-
91
-
92
-
93
-
94
-
95
-
96
-
97
-
98
-
99
-
100
-
101
-
102
-
103
-
104
-
105
-
106
-
107
-
108
-
109
-
110
-
111
-
112
-
113
-
114
-
115
-
116
-
117
-
118
-
119
-
120
-
121
-
 122
122 -
 123
123 -
 124
124 -
 125
125 -
 126
126 -
 127
127 -
 128
128 -
 129
129 -
 130
130 -
 131
131 -
 132
132 -
 133
133 -
 134
134 -
 135
135 -
 136
136 -
 137
137 -
 138
138 -
 139
139 -
 140
140 -
 141
141 -
 142
142 -
143
-
144
-
145
-
146
-
147
-
148
-
149
-
150
-
151
-
152
-
153
-
154
-
155
-
156
-
157
-
158
-
159
-
160
-
161
-
162
-
163
-
164
-
165
 |
 |

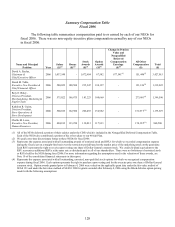
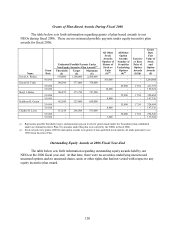
Grants of Plan-Based Awards During Fiscal 2006
The table below sets forth information regarding grants of plan-based awards to our
NEOs during fiscal 2006. There are no estimated possible payouts under equity incentive plan
awards for fiscal 2006.
Estimated Possible Payouts Under
Non-Equity Incentive Plan Awards(1)
Name
Grant
Date
Threshold
($)
Target
($)
Maximum
($)
All Other
Stock
Awards:
Number of
Shares of
Stock or
Units
(#)(2)
All Other
Option
Awards:
Number of
Securities
Underlying
Options
(#)(2)
Exercise
or Base
Price of
Option
Awards
($/Sh)
Grant
Date
Fair
Value of
Stock
and
Option
Awards
($)
David A. Perdue 550,000 1,100,000 2,200,000 - - - -
9/18/06 - - - 365,000 - - 5,204,900
David M. Tehle 188,500 377,000 754,000 - - - -
3/16/06 - - - - 69,900 17.54 411,739
3/16/06 - - - 10,600 - - 185,924
Beryl J. Buley 186,875 373,750 747,500 - - - -
3/16/06 - - - - 55,800 17.54 328,684
3/16/06 - - - 8,400 - - 147,336
Kathleen R. Guion 162,500 325,000 650,000 - - - -
3/16/06 - - - - 55,800 17.54 328,684
3/16/06 - - - 8,400 - - 147,336
Challis M. Lowe 133,250 266,500 533,000 - - - -
3/16/06 - - - - 50,000 17.54 294,520
3/16/06 - - - 7,600 - - 133,304
(1) Represents possible threshold, target, and maximum payout levels for grants made under the Teamshare plan established
under our Annual Incentive Plan. No amounts under this plan were earned by the NEOs in fiscal 2006.
(2) Stock awards were grants of RSUs and option awards were grants of non-qualified stock options, all made pursuant to our
1998 Stock Incentive Plan.
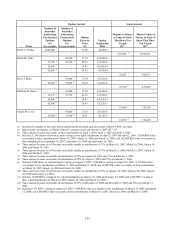
Outstanding Equity Awards at 2006 Fiscal Year-End
The table below sets forth information regarding outstanding equity awards held by our
NEOs at the 2006 fiscal year-end. At that time, there were no securities underlying unexercised
unearned options and no unearned shares, units or other rights that had not vested with respect to any
equity incentive plan award.
130