Dollar General 2006 Annual Report Download - page 48
Download and view the complete annual report
Please find page 48 of the 2006 Dollar General annual report below. You can navigate through the pages in the report by either clicking on the pages listed below, or by using the keyword search tool below to find specific information within the annual report.-
 1
1 -
2
-
3
-
4
-
5
-
6
-
7
-
8
-
9
-
10
-
11
-
12
-
13
-
14
-
15
-
16
-
17
-
18
-
19
-
20
-
21
-
22
-
23
-
24
-
25
-
26
-
27
-
28
-
29
-
30
-
31
-
32
-
33
-
34
-
35
-
36
-
37
-
 38
38 -
 39
39 -
 40
40 -
 41
41 -
 42
42 -
 43
43 -
 44
44 -
 45
45 -
 46
46 -
 47
47 -
 48
48 -
 49
49 -
 50
50 -
 51
51 -
 52
52 -
 53
53 -
 54
54 -
 55
55 -
 56
56 -
 57
57 -
 58
58 -
59
-
60
-
61
-
62
-
63
-
64
-
65
-
66
-
67
-
68
-
69
-
70
-
71
-
72
-
73
-
74
-
75
-
76
-
77
-
78
-
79
-
80
-
81
-
82
-
83
-
84
-
85
-
86
-
87
-
88
-
89
-
90
-
91
-
92
-
93
-
94
-
95
-
96
-
97
-
98
-
99
-
100
-
101
-
102
-
103
-
104
-
105
-
106
-
107
-
108
-
109
-
110
-
111
-
112
-
113
-
114
-
115
-
116
-
117
-
118
-
119
-
120
-
121
-
122
-
123
-
124
-
125
-
126
-
127
-
128
-
129
-
130
-
131
-
132
-
133
-
134
-
135
-
136
-
137
-
138
-
139
-
140
-
141
-
142
-
143
-
144
-
145
-
146
-
147
-
148
-
149
-
150
-
151
-
152
-
153
-
154
-
155
-
156
-
157
-
158
-
159
-
160
-
161
-
162
-
163
-
164
-
165
 |
 |

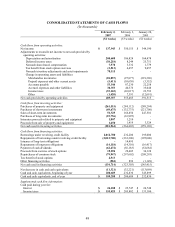
CONSOLIDATED BALANCE SHEETS
(In thousands except per share amounts)
February 2,
2007
February 3,
2006
Restated
(see Note 1)
ASSETS
Current assets:
Cash and cash equivalents $ 189,288 $ 200,609
Short-term investments 29,950 8,850
Merchandise inventories 1,432,336 1,474,414
Income taxes receivable 9,833 -
Deferred income taxes 24,321 -
Prepaid expenses and other current assets 57,020 51,339
Total current assets 1,742,748 1,735,212
Net property and equipment 1,236,874 1,192,172
Other assets, net 60,892 52,891
Total assets $ 3,040,514 $ 2,980,275
LIABILITIES AND SHAREHOLDERS’ EQUITY
Current liabilities:
Current portion of long-term obligations $ 8,080 $ 8,785
Accounts payable 555,274 508,386
Accrued expenses and other 253,558 242,354
Income taxes payable 15,959 43,706
Deferred income taxes - 7,267
Total current liabilities 832,871 810,498
Long-term obligations 261,958 269,962
Deferred income taxes 41,597 48,454
Other liabilities 158,341 130,566
Commitments and contingencies
Shareholders’ equity:
Series B junior participating preferred stock, stated
value $0.50 per share; Shares authorized:
10,000; Issued: None - -
Common stock, par value $0.50 per share;
Shares authorized: 500,000; Issued:
2006-312,436; 2005-315,679 156,218 157,840
Additional paid-in capital 486,145 462,383
Retained earnings 1,103,951 1,106,165
Accumulated other comprehensive loss (987) (794)
Other shareholders’ equity 420 (4,799)
Total shareholders’ equity 1,745,747 1,720,795
Total liabilities and shareholders’ equity $ 3,040,514 $ 2,980,275
The accompanying notes are an integral part of the consolidated financial statements.
46