Dollar General 2006 Annual Report Download - page 38
Download and view the complete annual report
Please find page 38 of the 2006 Dollar General annual report below. You can navigate through the pages in the report by either clicking on the pages listed below, or by using the keyword search tool below to find specific information within the annual report.-
 1
1 -
2
-
3
-
4
-
5
-
6
-
7
-
8
-
9
-
10
-
11
-
12
-
13
-
14
-
15
-
16
-
17
-
18
-
19
-
20
-
21
-
22
-
23
-
24
-
25
-
26
-
27
-
 28
28 -
 29
29 -
 30
30 -
 31
31 -
 32
32 -
 33
33 -
 34
34 -
 35
35 -
 36
36 -
 37
37 -
 38
38 -
 39
39 -
 40
40 -
 41
41 -
 42
42 -
 43
43 -
 44
44 -
 45
45 -
 46
46 -
 47
47 -
 48
48 -
49
-
50
-
51
-
52
-
53
-
54
-
55
-
56
-
57
-
58
-
59
-
60
-
61
-
62
-
63
-
64
-
65
-
66
-
67
-
68
-
69
-
70
-
71
-
72
-
73
-
74
-
75
-
76
-
77
-
78
-
79
-
80
-
81
-
82
-
83
-
84
-
85
-
86
-
87
-
88
-
89
-
90
-
91
-
92
-
93
-
94
-
95
-
96
-
97
-
98
-
99
-
100
-
101
-
102
-
103
-
104
-
105
-
106
-
107
-
108
-
109
-
110
-
111
-
112
-
113
-
114
-
115
-
116
-
117
-
118
-
119
-
120
-
121
-
122
-
123
-
124
-
125
-
126
-
127
-
128
-
129
-
130
-
131
-
132
-
133
-
134
-
135
-
136
-
137
-
138
-
139
-
140
-
141
-
142
-
143
-
144
-
145
-
146
-
147
-
148
-
149
-
150
-
151
-
152
-
153
-
154
-
155
-
156
-
157
-
158
-
159
-
160
-
161
-
162
-
163
-
164
-
165
 |
 |
assets are included in cash flows from investing activities and proceeds related to inventory
losses and business interruption are included in cash flows from operating activities.
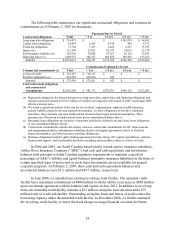
We believe that our existing cash balances ($189.3 million at February 2, 2007), cash
flows from operations ($405.4 million generated in 2006), the amended credit facility ($400
million available at February 2, 2007) and our anticipated ongoing access to the capital markets,
if necessary, will provide sufficient financing to meet our currently foreseeable liquidity and
capital resource needs.
Cash flows provided by operating activities. Cash flows from operating activities for
2006 compared to 2005 declined by $150.1 million. The most significant component of the
decline in cash flows from operating activities in 2006 as compared to 2005 was the reduction in
net income, as described in detail under “Results of Operations” above. Partially offsetting this
decline are certain noncash charges included in net income, including below-cost markdowns on
inventory balances and property and equipment impairment charges totaling $78.1 million, and a
$13.8 million increase in noncash depreciation and amortization charges in 2006 as compared to
2005. In addition, the reduction in 2006 year end inventory balances reflect the effect of below-
cost markdowns and our efforts to sell through excess inventories, as compared with increases in
2005 and 2004. Seasonal inventory levels increased by 2% in 2006 as compared to a 10%
increase in 2005, home products inventory levels declined by 25% in 2006 as compared to a 2%
increase in 2005, while basic clothing inventory levels declined by 21% in 2006 as compared to
a 5% decline in 2005. Total merchandise inventories at the end of 2006 were $1.43 billion
compared to $1.47 billion at the end of 2005, a 2.9% decrease overall, and a 6.4% decrease on a
per store basis, reflecting both our focus on liquidating packaway merchandise and the effect of
below-cost markdowns.
Cash flows from operating activities for 2005 compared to 2004 increased by $164.0
million. The most significant component of the increase in cash flows from operating activities
in the 2005 period as compared to the 2004 period was the change in inventory balances.
Seasonal inventory levels increased by 10% in 2005 as compared to a 22% increase in 2004,
home products inventory levels increased by 2% in 2005 as compared to a 16% increase in 2004,
while basic clothing inventory levels declined by 5% in 2005 as compared to a 21% increase in
2004. Total merchandise inventories at the end of 2005 were $1.47 billion compared to $1.38
billion at the end of 2004, a 7.1% increase overall, but a 1% decrease on a per store basis,
reflecting our 2005 focus on lowering our per store inventory levels.
Cash flows used in investing activities. Cash flows used in investing activities totaling
$282.0 million in 2006 were primarily related to capital expenditures and, to a lesser degree,
purchases of long-term investments. Significant components of our property and equipment
purchases in 2006 included the following approximate amounts: $66 million for distribution and
transportation-related capital expenditures (including approximately $30 million related to our
DC in Marion, Indiana which opened in 2006); $66 million for new stores; $50 million for the
EZstore project; and $38 million for capital projects in existing stores. During 2006 we opened
537 new stores and remodeled or relocated 64 stores.
Purchases and sales of short-term investments in 2006, which equaled net sales of $1.9
million, reflect our investment activities in tax-exempt auction rate securities as well as investing
36