Dollar General 2006 Annual Report Download - page 27
Download and view the complete annual report
Please find page 27 of the 2006 Dollar General annual report below. You can navigate through the pages in the report by either clicking on the pages listed below, or by using the keyword search tool below to find specific information within the annual report.-
 1
1 -
2
-
3
-
4
-
5
-
6
-
7
-
8
-
9
-
10
-
11
-
12
-
13
-
14
-
15
-
16
-
 17
17 -
 18
18 -
 19
19 -
 20
20 -
 21
21 -
 22
22 -
 23
23 -
 24
24 -
 25
25 -
 26
26 -
 27
27 -
 28
28 -
 29
29 -
 30
30 -
 31
31 -
 32
32 -
 33
33 -
 34
34 -
 35
35 -
 36
36 -
 37
37 -
38
-
39
-
40
-
41
-
42
-
43
-
44
-
45
-
46
-
47
-
48
-
49
-
50
-
51
-
52
-
53
-
54
-
55
-
56
-
57
-
58
-
59
-
60
-
61
-
62
-
63
-
64
-
65
-
66
-
67
-
68
-
69
-
70
-
71
-
72
-
73
-
74
-
75
-
76
-
77
-
78
-
79
-
80
-
81
-
82
-
83
-
84
-
85
-
86
-
87
-
88
-
89
-
90
-
91
-
92
-
93
-
94
-
95
-
96
-
97
-
98
-
99
-
100
-
101
-
102
-
103
-
104
-
105
-
106
-
107
-
108
-
109
-
110
-
111
-
112
-
113
-
114
-
115
-
116
-
117
-
118
-
119
-
120
-
121
-
122
-
123
-
124
-
125
-
126
-
127
-
128
-
129
-
130
-
131
-
132
-
133
-
134
-
135
-
136
-
137
-
138
-
139
-
140
-
141
-
142
-
143
-
144
-
145
-
146
-
147
-
148
-
149
-
150
-
151
-
152
-
153
-
154
-
155
-
156
-
157
-
158
-
159
-
160
-
161
-
162
-
163
-
164
-
165
 |
 |
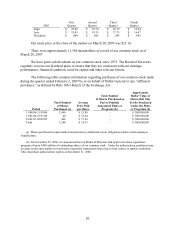
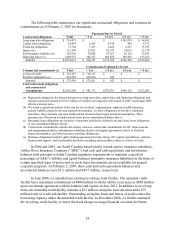
The remaining costs outlined in the table above are currently expected to be incurred in
2007, however, the amount and timing of these costs and charges as well as the amount of
below-cost inventory estimates and adjustments may vary materially depending on various
factors, including timing in the execution of the plan, the outcome of negotiations with landlords
and/or potential sublease tenants, the accuracy of assumptions used by management in
developing these estimates, final inventory levels, the timing and adequacy of markdowns, and
retail market conditions.
We expect markdowns from retail to continue at significantly higher than historical levels
throughout 2007, which will impact our expected gross profit. Specifically, we expect the gross
profit rate to sales to be in the low 27 percent range in fiscal 2007. We are targeting a gross profit
rate to sales of approximately 28 percent for fiscal 2008 and 29 percent for fiscal 2009. We
expect to increase our sales mix of merchandise categories with higher gross profit rates, such as
home, apparel and seasonal merchandise, as we become increasingly able to improve our
merchandise assortments and stock our stores with more current inventory. Achievement of our
gross profit targets is contingent upon this expected sales mix improvement as well as effective
inventory management and reductions in inventory shrink and damages.
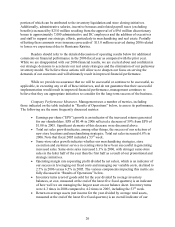
In addition to these strategic efforts, we have made progress in the following operating
initiatives outlined in our Annual Report on Form 10-K for the 2005 fiscal year:
• We completed our implementation of the EZstore process in all of our stores and
continue to be encouraged by our store managers’ response to the program and the
opportunities to reduce costs in labor, workers’ compensation, and damages, among
others.
• We completed construction of our ninth distribution center (“DC”) in Marion, Indiana
which commenced operations in August of 2006.
• Our new store layout has been implemented in 359 of our most recent new, relocated
or remodeled stores. Operating results of the new layout in these stores continue to be
encouraging, and we plan to implement this new format in the majority of new stores
to be opened or relocated in fiscal 2007.
• We generated sufficient cash flow to allow us to repurchase approximately 4.5
million shares of our common stock for $79.9 million and to pay dividends of $62.5
million, an increase per share of 14 percent.
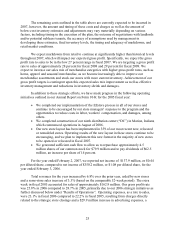
For the year ended February 2, 2007, we reported net income of $137.9 million, or $0.44
per diluted share, compared to net income of $350.2 million, or $1.08 per diluted share, for the
year ended February 3, 2006.
Total revenues for the year increased by 6.8% over the prior year, aided by new stores
and a same-store sales increase of 3.3% (based on the comparable 52-week period). The extra
week in fiscal 2005 accounted for sales of approximately $162.9 million. Our gross profit rate
was 25.8% in 2006 compared to 28.7% in 2005, primarily due to our 2006 strategic initiatives as
further discussed below under “Results of Operations”. Operating expenses, as a rate to sales,
were 23.1% in fiscal 2006 compared to 22.2% in fiscal 2005, resulting from charges directly
related to the strategic store closings and a $29.9 million increase in advertising expenses, a
25