Delta Airlines 2003 Annual Report Download - page 89
Download and view the complete annual report
Please find page 89 of the 2003 Delta Airlines annual report below. You can navigate through the pages in the report by either clicking on the pages listed below, or by using the keyword search tool below to find specific information within the annual report.-
 1
1 -
2
-
3
-
4
-
5
-
6
-
7
-
8
-
9
-
10
-
11
-
12
-
13
-
14
-
15
-
16
-
17
-
18
-
19
-
20
-
21
-
22
-
23
-
24
-
25
-
26
-
27
-
28
-
29
-
30
-
31
-
32
-
33
-
34
-
35
-
36
-
37
-
38
-
39
-
40
-
41
-
42
-
43
-
44
-
45
-
46
-
47
-
48
-
49
-
50
-
51
-
52
-
53
-
54
-
55
-
56
-
57
-
58
-
59
-
60
-
61
-
62
-
63
-
64
-
65
-
66
-
67
-
68
-
69
-
70
-
71
-
72
-
73
-
74
-
75
-
76
-
77
-
78
-
 79
79 -
 80
80 -
 81
81 -
 82
82 -
 83
83 -
 84
84 -
 85
85 -
 86
86 -
 87
87 -
 88
88 -
 89
89 -
 90
90 -
 91
91 -
 92
92 -
 93
93 -
 94
94 -
 95
95 -
 96
96 -
 97
97 -
 98
98 -
 99
99 -
100
-
101
-
102
-
103
-
104
-
105
-
106
-
107
-
108
-
109
-
110
-
111
-
112
-
113
-
114
-
115
-
116
-
117
-
118
-
119
-
120
-
121
-
122
-
123
-
124
-
125
-
126
-
127
-
128
-
129
-
130
-
131
-
132
-
133
-
134
-
135
-
136
-
137
-
138
-
139
-
140
-
141
-
142
-
143
-
144
-
145
-
146
-
147
-
148
-
149
-
150
-
151
-
152
-
153
-
154
-
155
-
156
-
157
-
158
-
159
-
160
-
161
-
162
-
163
-
164
-
165
-
166
-
167
-
168
-
169
-
170
-
171
-
172
-
173
-
174
-
175
-
176
-
177
-
178
-
179
-
180
-
181
-
182
-
183
-
184
-
185
-
186
-
187
-
188
-
189
-
190
-
191
-
192
-
193
-
194
-
195
-
196
-
197
-
198
-
199
-
200
-
201
-
202
-
203
-
204
-
205
-
206
-
207
-
208
-
209
-
210
-
211
-
212
-
213
-
214
-
215
-
216
-
217
-
218
-
219
-
220
-
221
-
222
-
223
-
224
-
225
-
226
-
227
-
228
-
229
-
230
-
231
-
232
-
233
-
234
-
235
-
236
-
237
-
238
-
239
-
240
-
241
-
242
-
243
-
244
-
245
-
246
-
247
-
248
-
249
-
250
-
251
-
252
-
253
-
254
-
255
-
256
-
257
-
258
-
259
-
260
-
261
-
262
-
263
-
264
-
265
-
266
-
267
-
268
-
269
-
270
-
271
-
272
-
273
-
274
-
275
-
276
-
277
-
278
-
279
-
280
-
281
-
282
-
283
-
284
-
285
-
286
-
287
-
288
-
289
-
290
-
291
-
292
-
293
-
294
-
295
-
296
-
297
-
298
-
299
-
300
-
301
-
302
-
303
-
304
 |
 |
Table of Contents
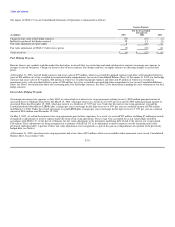
The estimated fair values of stock options granted during the years ended December 31, 2003, 2002 and 2001 were derived using the Black-Scholes model.
The following table includes the assumptions used in estimating fair values and the resulting weighted average fair value of a stock option granted in the
periods presented:
Stock Options Granted
Assumption 2003 2002 2001
Risk-free interest rate 2.2% 4.4% 5.8%
Average expected life of stock options (in years) 2.9 6.7 7.5
Expected volatility of common stock 66.4% 38.9% 26.9%
Expected annual dividends on common stock $ — $ 0.10 $ 0.10
Weighted average fair value of a stock option granted $ 5 $ 9 $ 20
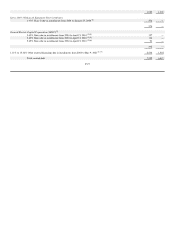
The following table shows what our net loss and loss per share would have been for the years ended December 31, 2003, 2002 and 2001 had we accounted for
our stock-based compensation plans under the fair value method of SFAS 123, "Accounting for Stock-Based Compensation" (SFAS 123), as amended by
SFAS 148, using the assumptions in the table above:
(in millions, except per share data) 2003 2002 2001
Net loss:
As reported $ (773) $ (1,272) $ (1,216)
Deduct: total stock option compensation expense determined under the fair value based method, net of tax (33) (47) (30)
As adjusted for the fair value method under SFAS 123 $ (806) $ (1,319) $ (1,246)
Basic and diluted loss per share:
As reported $ (6.40) $ (10.44) $ (9.99)
As adjusted for the fair value method under SFAS 123 $ (6.66) $ (10.82) $ (10.23)
Fair Value of Financial Instruments
We record our cash equivalents and short-term investments at cost, which we believe approximates their fair values. The estimated fair values of other
financial instruments, including debt and derivative instruments, have been determined using available market information and valuation methodologies,
primarily discounted cash flow analyses and the Black-Scholes model.
Note 2. Marketable and Other Equity Securities
priceline.com Incorporated (priceline)
We are party to an agreement with priceline under which we (1) provide ticket inventory that may be sold through priceline's Internet-based e-commerce
system and (2) received certain equity interests in priceline. We are required to provide priceline access to unpublished fares.
2001
At January 1, 2001, our equity interests in priceline included (1) a warrant, as amended, which is exercisable until November 17, 2004, to purchase up to 4.7
million shares of priceline common stock for $4.72 per share (1999 Warrant) and (2) six million shares of priceline Series A
F-19