Delta Airlines 2003 Annual Report Download - page 47
Download and view the complete annual report
Please find page 47 of the 2003 Delta Airlines annual report below. You can navigate through the pages in the report by either clicking on the pages listed below, or by using the keyword search tool below to find specific information within the annual report.-
 1
1 -
 2
2 -
 3
3 -
 4
4 -
 5
5 -
 6
6 -
 7
7 -
 8
8 -
 9
9 -
 10
10 -
 11
11 -
 12
12 -
 13
13 -
 14
14 -
 15
15 -
 16
16 -
 17
17 -
 18
18 -
 19
19 -
 20
20 -
 21
21 -
 22
22 -
 23
23 -
 24
24 -
 25
25 -
 26
26 -
 27
27 -
 28
28 -
 29
29 -
 30
30 -
 31
31 -
 32
32 -
 33
33 -
 34
34 -
 35
35 -
 36
36 -
 37
37 -
 38
38 -
 39
39 -
 40
40 -
 41
41 -
 42
42 -
 43
43 -
 44
44 -
 45
45 -
 46
46 -
 47
47 -
 48
48 -
 49
49 -
 50
50 -
 51
51 -
 52
52 -
 53
53 -
 54
54 -
 55
55 -
 56
56 -
 57
57 -
 58
58 -
 59
59 -
 60
60 -
 61
61 -
 62
62 -
 63
63 -
 64
64 -
 65
65 -
 66
66 -
 67
67 -
 68
68 -
 69
69 -
 70
70 -
 71
71 -
 72
72 -
 73
73 -
 74
74 -
 75
75 -
 76
76 -
 77
77 -
 78
78 -
 79
79 -
 80
80 -
 81
81 -
 82
82 -
 83
83 -
 84
84 -
 85
85 -
 86
86 -
 87
87 -
 88
88 -
 89
89 -
 90
90 -
 91
91 -
 92
92 -
 93
93 -
 94
94 -
 95
95 -
 96
96 -
 97
97 -
 98
98 -
 99
99 -
 100
100 -
 101
101 -
 102
102 -
 103
103 -
 104
104 -
 105
105 -
 106
106 -
 107
107 -
 108
108 -
 109
109 -
 110
110 -
 111
111 -
 112
112 -
 113
113 -
 114
114 -
 115
115 -
 116
116 -
 117
117 -
 118
118 -
 119
119 -
 120
120 -
 121
121 -
 122
122 -
 123
123 -
 124
124 -
 125
125 -
 126
126 -
 127
127 -
 128
128 -
 129
129 -
 130
130 -
 131
131 -
 132
132 -
 133
133 -
 134
134 -
 135
135 -
 136
136 -
 137
137 -
 138
138 -
 139
139 -
 140
140 -
 141
141 -
 142
142 -
 143
143 -
 144
144 -
 145
145 -
 146
146 -
 147
147 -
 148
148 -
 149
149 -
 150
150 -
 151
151 -
 152
152 -
 153
153 -
 154
154 -
 155
155 -
 156
156 -
 157
157 -
 158
158 -
 159
159 -
 160
160 -
 161
161 -
 162
162 -
 163
163 -
 164
164 -
 165
165 -
 166
166 -
 167
167 -
 168
168 -
 169
169 -
 170
170 -
 171
171 -
 172
172 -
 173
173 -
 174
174 -
 175
175 -
 176
176 -
 177
177 -
 178
178 -
 179
179 -
 180
180 -
 181
181 -
 182
182 -
 183
183 -
 184
184 -
 185
185 -
 186
186 -
 187
187 -
 188
188 -
 189
189 -
 190
190 -
 191
191 -
 192
192 -
 193
193 -
 194
194 -
 195
195 -
 196
196 -
 197
197 -
 198
198 -
 199
199 -
 200
200 -
 201
201 -
 202
202 -
 203
203 -
 204
204 -
 205
205 -
 206
206 -
 207
207 -
 208
208 -
 209
209 -
 210
210 -
 211
211 -
 212
212 -
 213
213 -
 214
214 -
 215
215 -
 216
216 -
 217
217 -
 218
218 -
 219
219 -
 220
220 -
 221
221 -
 222
222 -
 223
223 -
 224
224 -
 225
225 -
 226
226 -
 227
227 -
 228
228 -
 229
229 -
 230
230 -
 231
231 -
 232
232 -
 233
233 -
 234
234 -
 235
235 -
 236
236 -
 237
237 -
 238
238 -
 239
239 -
 240
240 -
 241
241 -
 242
242 -
 243
243 -
 244
244 -
 245
245 -
 246
246 -
 247
247 -
 248
248 -
 249
249 -
 250
250 -
 251
251 -
 252
252 -
 253
253 -
 254
254 -
 255
255 -
 256
256 -
 257
257 -
 258
258 -
 259
259 -
 260
260 -
 261
261 -
 262
262 -
 263
263 -
 264
264 -
 265
265 -
 266
266 -
 267
267 -
 268
268 -
 269
269 -
 270
270 -
 271
271 -
 272
272 -
 273
273 -
 274
274 -
 275
275 -
 276
276 -
 277
277 -
 278
278 -
 279
279 -
 280
280 -
 281
281 -
 282
282 -
 283
283 -
 284
284 -
 285
285 -
 286
286 -
 287
287 -
 288
288 -
 289
289 -
 290
290 -
 291
291 -
 292
292 -
 293
293 -
 294
294 -
 295
295 -
 296
296 -
 297
297 -
 298
298 -
 299
299 -
 300
300 -
 301
301 -
 302
302 -
 303
303 -
 304
304
 |
 |

Table of Contents
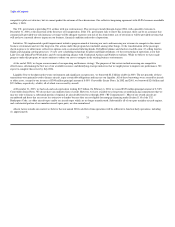
Passenger commission expense declined 40%, primarily due to a change in our commission rate structure. On March 14, 2002, we eliminated travel agent
base commissions for tickets sold in the U.S. and Canada. Passenger service expense decreased 20%, primarily due to meal service reductions.
Restructuring, asset writedowns, pension settlements and related items, net totaled $439 million in 2002 compared to $1.1 billion in 2001. Our 2002 charge
is discussed above. Our 2001 charge consists of (1) $566 million related to our 2001 workforce reduction programs; (2) $363 million from a decrease in value
of certain aircraft and other fleet related charges; (3) $160 million related primarily to discontinued contracts, facilities and information technology projects;
and (4) $30 million for the temporary carrying cost of surplus pilots and grounded aircraft. For additional information on restructuring, asset writedowns,
pension settlements and related items, net, see Note 15 of the Notes to the Consolidated Financial Statements.
Stabilization Act compensation totaled $34 million in 2002 compared to $634 million in 2001, representing amounts we recognized as compensation in the
applicable period under the Stabilization Act. For additional information about the Stabilization Act, see Note 19 of the Notes to the Consolidated Financial
Statements.
Other operating expenses decreased 11%, primarily due to declines in miscellaneous expenses such as supplies, utilities, interrupted operations expenses
and professional fees, which were partially offset by a 19% increase in expenses due to a rise in war-risk insurance rates.
Operating Loss and Operating Margin. We incurred an operating loss of $1.3 billion in 2002, compared to an operating loss of $1.6 billion in 2001.
Operating margin was (10%) and (12%) for 2002 and 2001, respectively.
Other Income (Expense). Other expense totaled $693 million during 2002, compared to other expense of $262 million in 2001. Included in these results are
the following:
• A $147 million increase in interest expense in 2002 compared to 2001 primarily due to higher levels of outstanding debt in 2002.
• A $53 million decrease in interest income in 2002 compared to 2001 due to lower interest rates and a lower average cash balance in 2002.
• A $127 million net gain in 2001 on the sale of certain investments. This primarily relates to a $111 million gain on the sale of our equity interest in
SkyWest, Inc., the parent company of SkyWest Airlines, and an $11 million gain from the sale of our equity interest in Equant, N.V., an international
data network services company.
• A $39 million charge in 2002 compared to a $68 million gain in 2001 for fair value adjustments of financial instruments accounted for under SFAS
133. This relates to derivative instruments we use in our fuel hedging program and to our equity warrants and other similar rights in certain companies.
• A $42 million loss on extinguishment of debt in 2002, which resulted from our repurchase of a portion of outstanding ESOP Notes.
40
