Delta Airlines 2003 Annual Report Download - page 115
Download and view the complete annual report
Please find page 115 of the 2003 Delta Airlines annual report below. You can navigate through the pages in the report by either clicking on the pages listed below, or by using the keyword search tool below to find specific information within the annual report.-
 1
1 -
2
-
3
-
4
-
5
-
6
-
7
-
8
-
9
-
10
-
11
-
12
-
13
-
14
-
15
-
16
-
17
-
18
-
19
-
20
-
21
-
22
-
23
-
24
-
25
-
26
-
27
-
28
-
29
-
30
-
31
-
32
-
33
-
34
-
35
-
36
-
37
-
38
-
39
-
40
-
41
-
42
-
43
-
44
-
45
-
46
-
47
-
48
-
49
-
50
-
51
-
52
-
53
-
54
-
55
-
56
-
57
-
58
-
59
-
60
-
61
-
62
-
63
-
64
-
65
-
66
-
67
-
68
-
69
-
70
-
71
-
72
-
73
-
74
-
75
-
76
-
77
-
78
-
79
-
80
-
81
-
82
-
83
-
84
-
85
-
86
-
87
-
88
-
89
-
90
-
91
-
92
-
93
-
94
-
95
-
96
-
97
-
98
-
99
-
100
-
101
-
102
-
103
-
104
-
 105
105 -
 106
106 -
 107
107 -
 108
108 -
 109
109 -
 110
110 -
 111
111 -
 112
112 -
 113
113 -
 114
114 -
 115
115 -
 116
116 -
 117
117 -
 118
118 -
 119
119 -
 120
120 -
 121
121 -
 122
122 -
 123
123 -
 124
124 -
 125
125 -
126
-
127
-
128
-
129
-
130
-
131
-
132
-
133
-
134
-
135
-
136
-
137
-
138
-
139
-
140
-
141
-
142
-
143
-
144
-
145
-
146
-
147
-
148
-
149
-
150
-
151
-
152
-
153
-
154
-
155
-
156
-
157
-
158
-
159
-
160
-
161
-
162
-
163
-
164
-
165
-
166
-
167
-
168
-
169
-
170
-
171
-
172
-
173
-
174
-
175
-
176
-
177
-
178
-
179
-
180
-
181
-
182
-
183
-
184
-
185
-
186
-
187
-
188
-
189
-
190
-
191
-
192
-
193
-
194
-
195
-
196
-
197
-
198
-
199
-
200
-
201
-
202
-
203
-
204
-
205
-
206
-
207
-
208
-
209
-
210
-
211
-
212
-
213
-
214
-
215
-
216
-
217
-
218
-
219
-
220
-
221
-
222
-
223
-
224
-
225
-
226
-
227
-
228
-
229
-
230
-
231
-
232
-
233
-
234
-
235
-
236
-
237
-
238
-
239
-
240
-
241
-
242
-
243
-
244
-
245
-
246
-
247
-
248
-
249
-
250
-
251
-
252
-
253
-
254
-
255
-
256
-
257
-
258
-
259
-
260
-
261
-
262
-
263
-
264
-
265
-
266
-
267
-
268
-
269
-
270
-
271
-
272
-
273
-
274
-
275
-
276
-
277
-
278
-
279
-
280
-
281
-
282
-
283
-
284
-
285
-
286
-
287
-
288
-
289
-
290
-
291
-
292
-
293
-
294
-
295
-
296
-
297
-
298
-
299
-
300
-
301
-
302
-
303
-
304
 |
 |

Table of Contents
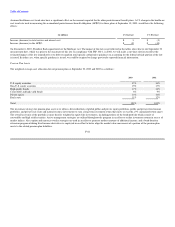
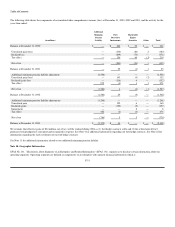
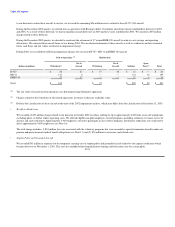
Assumed healthcare cost trend rates have a significant effect on the amounts reported for the other postretirement benefit plans. A 1% change in the healthcare
cost trend rate used in measuring the accumulated postretirement benefit obligation (APBO) for these plans at September 30, 2003, would have the following
effects:
(in millions) 1% Increase 1% Decrease
Increase (decrease) in total service and interest cost $ 3 $ (3)
Increase (decrease) in the APBO $ 49 $ (44)
On December 8, 2003, President Bush signed into law the Medicare Act. The impact of this law is not reflected in the tables above due to our September 30
measurement date, which was prior to the enactment of this law. In compliance with FSP 106-1, in 2004, we will make a one-time election to reflect the
estimated impact of the law immediately or to defer recognition until specific authoritative guidance on accounting for the federal subsidy portion of the law
is issued. In either case, when specific guidance is issued, we could be required to change previously reported financial information.
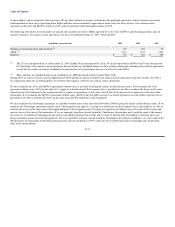
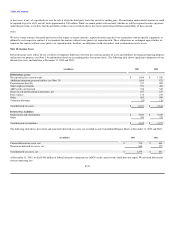
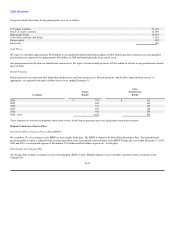
Pension Plan Assets
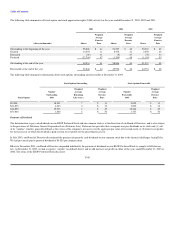
The weighted-average asset allocation for our pension plans at September 30, 2003 and 2002 is as follows :
2003 2002
U.S. equity securities 35% 34%
Non-U.S. equity securities 15% 17%
High quality bonds 17% 14%
Convertible and high yield bonds 8% 9%
Private equity 14% 14%
Real estate 11% 12%
Total 100% 100%
The investment strategy for pension plan assets is to utilize a diversified mix of global public and private equity portfolios, public and private fixed income
portfolios, and private real estate and natural resource investments to earn a long-term investment return that meets or exceeds a 9% annualized return target.
The overall asset mix of the portfolio is more heavily weighted in equity-like investments, including portions of the bond portfolio which consist of
convertible and high yield securities. Active management strategies are utilized throughout the program in an effort to realize investment returns in excess of
market indices. Also, option and currency overlay strategies are used in an effort to generate modest amounts of additional income, and a bond duration
extension program utilizing fixed income derivatives is employed in an effort to better align the market value movements of a portion of the pension plan
assets to the related pension plan liabilities.
F-44