Delta Airlines 2003 Annual Report Download - page 43
Download and view the complete annual report
Please find page 43 of the 2003 Delta Airlines annual report below. You can navigate through the pages in the report by either clicking on the pages listed below, or by using the keyword search tool below to find specific information within the annual report.-
 1
1 -
2
-
3
-
4
-
5
-
6
-
7
-
8
-
9
-
10
-
11
-
12
-
13
-
14
-
15
-
16
-
17
-
18
-
19
-
20
-
21
-
22
-
23
-
24
-
25
-
26
-
27
-
28
-
29
-
30
-
31
-
32
-
 33
33 -
 34
34 -
 35
35 -
 36
36 -
 37
37 -
 38
38 -
 39
39 -
 40
40 -
 41
41 -
 42
42 -
 43
43 -
 44
44 -
 45
45 -
 46
46 -
 47
47 -
 48
48 -
 49
49 -
 50
50 -
 51
51 -
 52
52 -
 53
53 -
54
-
55
-
56
-
57
-
58
-
59
-
60
-
61
-
62
-
63
-
64
-
65
-
66
-
67
-
68
-
69
-
70
-
71
-
72
-
73
-
74
-
75
-
76
-
77
-
78
-
79
-
80
-
81
-
82
-
83
-
84
-
85
-
86
-
87
-
88
-
89
-
90
-
91
-
92
-
93
-
94
-
95
-
96
-
97
-
98
-
99
-
100
-
101
-
102
-
103
-
104
-
105
-
106
-
107
-
108
-
109
-
110
-
111
-
112
-
113
-
114
-
115
-
116
-
117
-
118
-
119
-
120
-
121
-
122
-
123
-
124
-
125
-
126
-
127
-
128
-
129
-
130
-
131
-
132
-
133
-
134
-
135
-
136
-
137
-
138
-
139
-
140
-
141
-
142
-
143
-
144
-
145
-
146
-
147
-
148
-
149
-
150
-
151
-
152
-
153
-
154
-
155
-
156
-
157
-
158
-
159
-
160
-
161
-
162
-
163
-
164
-
165
-
166
-
167
-
168
-
169
-
170
-
171
-
172
-
173
-
174
-
175
-
176
-
177
-
178
-
179
-
180
-
181
-
182
-
183
-
184
-
185
-
186
-
187
-
188
-
189
-
190
-
191
-
192
-
193
-
194
-
195
-
196
-
197
-
198
-
199
-
200
-
201
-
202
-
203
-
204
-
205
-
206
-
207
-
208
-
209
-
210
-
211
-
212
-
213
-
214
-
215
-
216
-
217
-
218
-
219
-
220
-
221
-
222
-
223
-
224
-
225
-
226
-
227
-
228
-
229
-
230
-
231
-
232
-
233
-
234
-
235
-
236
-
237
-
238
-
239
-
240
-
241
-
242
-
243
-
244
-
245
-
246
-
247
-
248
-
249
-
250
-
251
-
252
-
253
-
254
-
255
-
256
-
257
-
258
-
259
-
260
-
261
-
262
-
263
-
264
-
265
-
266
-
267
-
268
-
269
-
270
-
271
-
272
-
273
-
274
-
275
-
276
-
277
-
278
-
279
-
280
-
281
-
282
-
283
-
284
-
285
-
286
-
287
-
288
-
289
-
290
-
291
-
292
-
293
-
294
-
295
-
296
-
297
-
298
-
299
-
300
-
301
-
302
-
303
-
304
 |
 |

Table of Contents
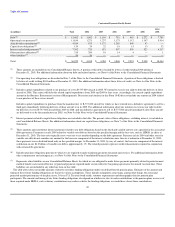
to our 2002 workforce reduction programs. The increase in pension expense mainly reflects the impact of declining interest rates, a decrease in the fair value
of pension plan assets and scheduled pilot salary increases, partially offset by approximately $120 million in expense reductions from the transition of our
non-pilot defined benefit pension plan to a cash balance plan. For additional information related to this transition, see Note 11 of the Notes to the Consolidated
Financial Statements.
Aircraft fuel expense totaled $1.9 billion during 2003, a 15% increase from 2002. This increase is primarily due to higher fuel prices, partially offset by
capacity reductions. The average fuel price per gallon rose 22% to 81.78¢, while total gallons consumed decreased 6%. Our fuel cost is shown net of fuel
hedge gains of $152 million for 2003 and $136 million for 2002. Approximately 65% and 56% of our aircraft fuel requirements were hedged during 2003 and
2002, respectively. For additional information about our fuel hedge contracts, see Note 4 of the Notes to the Consolidated Financial Statements.
Depreciation and amortization expense rose 5% in 2003, primarily due to the acquisition of regional jet aircraft and an increase in software amortization
associated with completed technology projects.
Contracted services expense declined 12% primarily due to reduced traffic and capacity, the suspension of the air carrier security fees under the
Emergency Wartime Supplemental Appropriations Act ("Appropriations Act") between June 1, 2003 and September 30, 2003, and a decrease in contracted
services across certain workgroups. For additional information about the Appropriations Act, see Note 19 of the Notes to the Consolidated Financial
Statements.
Landing fees and other rents rose 3%, primarily due to higher landing fees, adopted by airports seeking to recover lost revenue due to decreased traffic, and
increased facility rates. Aircraft maintenance materials and outside repairs expense fell 11%, primarily from reduced maintenance volume and materials
consumption as a result of process improvement initiatives, lower capacity and our fleet simplification program. Aircraft rent expense increased 3% mainly
due to our decision in the December 2002 quarter to return our B-737-300 leased aircraft to service during 2003. For additional information related to this
decision, see Note 15 of the Notes to Consolidated Financial Statements.
Other selling expenses fell 11%. This increase primarily reflects a 9% decrease related to lower booking fees resulting from decreased traffic and a 3%
decline from higher sales of mileage credits under our SkyMiles program because a portion of this revenue is recorded as an offset to other selling expenses.
These decreases were partially offset by an increase in advertising expenses due to the launch of Song, our new low-fare service. Passenger commission
expense declined 34%, primarily reflecting a 22% decrease from the change in our commission rate structure in 2002, which resulted in the elimination of
travel agent base commissions for tickets sold in the U.S. and Canada. The decrease in passenger commissions also reflects the cancellation or renegotiation
of certain travel agent contracts and a lower volume of base and incentive commissions. Passenger service expense decreased 13%, primarily reflecting a 10%
decline from decreased traffic and capacity and a 7% decrease due to certain meal service-related cost savings initiatives.
36