Delta Airlines 2003 Annual Report Download - page 39
Download and view the complete annual report
Please find page 39 of the 2003 Delta Airlines annual report below. You can navigate through the pages in the report by either clicking on the pages listed below, or by using the keyword search tool below to find specific information within the annual report.-
 1
1 -
2
-
3
-
4
-
5
-
6
-
7
-
8
-
9
-
10
-
11
-
12
-
13
-
14
-
15
-
16
-
17
-
18
-
19
-
20
-
21
-
22
-
23
-
24
-
25
-
26
-
27
-
28
-
 29
29 -
 30
30 -
 31
31 -
 32
32 -
 33
33 -
 34
34 -
 35
35 -
 36
36 -
 37
37 -
 38
38 -
 39
39 -
 40
40 -
 41
41 -
 42
42 -
 43
43 -
 44
44 -
 45
45 -
 46
46 -
 47
47 -
 48
48 -
 49
49 -
50
-
51
-
52
-
53
-
54
-
55
-
56
-
57
-
58
-
59
-
60
-
61
-
62
-
63
-
64
-
65
-
66
-
67
-
68
-
69
-
70
-
71
-
72
-
73
-
74
-
75
-
76
-
77
-
78
-
79
-
80
-
81
-
82
-
83
-
84
-
85
-
86
-
87
-
88
-
89
-
90
-
91
-
92
-
93
-
94
-
95
-
96
-
97
-
98
-
99
-
100
-
101
-
102
-
103
-
104
-
105
-
106
-
107
-
108
-
109
-
110
-
111
-
112
-
113
-
114
-
115
-
116
-
117
-
118
-
119
-
120
-
121
-
122
-
123
-
124
-
125
-
126
-
127
-
128
-
129
-
130
-
131
-
132
-
133
-
134
-
135
-
136
-
137
-
138
-
139
-
140
-
141
-
142
-
143
-
144
-
145
-
146
-
147
-
148
-
149
-
150
-
151
-
152
-
153
-
154
-
155
-
156
-
157
-
158
-
159
-
160
-
161
-
162
-
163
-
164
-
165
-
166
-
167
-
168
-
169
-
170
-
171
-
172
-
173
-
174
-
175
-
176
-
177
-
178
-
179
-
180
-
181
-
182
-
183
-
184
-
185
-
186
-
187
-
188
-
189
-
190
-
191
-
192
-
193
-
194
-
195
-
196
-
197
-
198
-
199
-
200
-
201
-
202
-
203
-
204
-
205
-
206
-
207
-
208
-
209
-
210
-
211
-
212
-
213
-
214
-
215
-
216
-
217
-
218
-
219
-
220
-
221
-
222
-
223
-
224
-
225
-
226
-
227
-
228
-
229
-
230
-
231
-
232
-
233
-
234
-
235
-
236
-
237
-
238
-
239
-
240
-
241
-
242
-
243
-
244
-
245
-
246
-
247
-
248
-
249
-
250
-
251
-
252
-
253
-
254
-
255
-
256
-
257
-
258
-
259
-
260
-
261
-
262
-
263
-
264
-
265
-
266
-
267
-
268
-
269
-
270
-
271
-
272
-
273
-
274
-
275
-
276
-
277
-
278
-
279
-
280
-
281
-
282
-
283
-
284
-
285
-
286
-
287
-
288
-
289
-
290
-
291
-
292
-
293
-
294
-
295
-
296
-
297
-
298
-
299
-
300
-
301
-
302
-
303
-
304
 |
 |

Table of Contents
Due to the changes that have occurred in the airline industry, we must significantly reduce our costs in order to be competitive in the current environment
and over the long-term. Our cost structure is materially higher than that of the low-cost airlines with which we compete. Moreover, as mentioned above, other
hub and spoke airlines, such as American Airlines, United Airlines and US Airways, have significantly reduced their costs through bankruptcy or the threat of
bankruptcy. Our unit costs have gone from being among the lowest of the hub and spoke airlines to among the highest for 2003, a result which places us at a
serious competitive disadvantage.
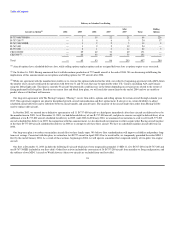
Revenues. Our operating revenues were $13.3 billion in 2003, which was unchanged from our operating revenues in 2002 and 4% lower than our operating
revenues in 2001. Our operating revenue performance in 2003 reflects the depressed revenue environment discussed above. During 2003, our and other
airlines' revenues were also negatively impacted by the military action in Iraq.
International traffic, particularly in our Atlantic region, experienced the greatest impact related to the situation in Iraq, declining 12% for 2003 as compared
to the prior year. Year-over-year increases in our military charter revenues in 2003 partially offset the negative effect of these events.
In April 2003, we implemented a 12% reduction in mainline capacity due to the military action in Iraq. Because there has been some improvement in
passenger demand since the end of major military combat in Iraq in May 2003, we have now restored most of this capacity.
Costs. Our cost pressures for 2003 compared to 2002 included increases in pension, aircraft fuel and interest expense. Pension and related expense
increased approximately $290 million, primarily due to declining interest rates, a decrease in the fair value of our pension plan assets and scheduled pilot
salary increases under the pilots' collective bargaining agreement. Aircraft fuel expense rose $255 million, mainly due to the rise in fuel prices to historically
high levels in the period leading up to the military action in Iraq and again during the December 2003 quarter. Our interest expense increased $86 million,
largely due to higher levels of debt outstanding based on our substantial increase in borrowings as discussed below.
We expect these cost pressures to continue during 2004. We estimate that the total annual increase for 2004 compared to 2003 related to aircraft fuel,
pension and related, and interest expense will be approximately $180 million, $130 million and $75 million, respectively. Our estimated increase in aircraft
fuel expense assumes an average fuel price per gallon in 2004 of approximately 84¢, a 3% increase over 2003, on our projected aircraft fuel consumption of
approximately 2.5 billion gallons.
Salaries and related costs represented 45% and 42% of our total operating expenses for 2003 and 2002, respectively. We have taken actions, such as
workforce reductions and changes in our non-pilot employee benefits, to reduce employee-related costs. Our pilot cost structure is, however, significantly
higher than our competitors. It is critical to reduce our costs in order to be competitive with other airlines. We are currently in discussions with ALPA, to
move toward a
32