Delta Airlines 2003 Annual Report Download - page 79
Download and view the complete annual report
Please find page 79 of the 2003 Delta Airlines annual report below. You can navigate through the pages in the report by either clicking on the pages listed below, or by using the keyword search tool below to find specific information within the annual report.-
 1
1 -
2
-
3
-
4
-
5
-
6
-
7
-
8
-
9
-
10
-
11
-
12
-
13
-
14
-
15
-
16
-
17
-
18
-
19
-
20
-
21
-
22
-
23
-
24
-
25
-
26
-
27
-
28
-
29
-
30
-
31
-
32
-
33
-
34
-
35
-
36
-
37
-
38
-
39
-
40
-
41
-
42
-
43
-
44
-
45
-
46
-
47
-
48
-
49
-
50
-
51
-
52
-
53
-
54
-
55
-
56
-
57
-
58
-
59
-
60
-
61
-
62
-
63
-
64
-
65
-
66
-
67
-
68
-
 69
69 -
 70
70 -
 71
71 -
 72
72 -
 73
73 -
 74
74 -
 75
75 -
 76
76 -
 77
77 -
 78
78 -
 79
79 -
 80
80 -
 81
81 -
 82
82 -
 83
83 -
 84
84 -
 85
85 -
 86
86 -
 87
87 -
 88
88 -
 89
89 -
90
-
91
-
92
-
93
-
94
-
95
-
96
-
97
-
98
-
99
-
100
-
101
-
102
-
103
-
104
-
105
-
106
-
107
-
108
-
109
-
110
-
111
-
112
-
113
-
114
-
115
-
116
-
117
-
118
-
119
-
120
-
121
-
122
-
123
-
124
-
125
-
126
-
127
-
128
-
129
-
130
-
131
-
132
-
133
-
134
-
135
-
136
-
137
-
138
-
139
-
140
-
141
-
142
-
143
-
144
-
145
-
146
-
147
-
148
-
149
-
150
-
151
-
152
-
153
-
154
-
155
-
156
-
157
-
158
-
159
-
160
-
161
-
162
-
163
-
164
-
165
-
166
-
167
-
168
-
169
-
170
-
171
-
172
-
173
-
174
-
175
-
176
-
177
-
178
-
179
-
180
-
181
-
182
-
183
-
184
-
185
-
186
-
187
-
188
-
189
-
190
-
191
-
192
-
193
-
194
-
195
-
196
-
197
-
198
-
199
-
200
-
201
-
202
-
203
-
204
-
205
-
206
-
207
-
208
-
209
-
210
-
211
-
212
-
213
-
214
-
215
-
216
-
217
-
218
-
219
-
220
-
221
-
222
-
223
-
224
-
225
-
226
-
227
-
228
-
229
-
230
-
231
-
232
-
233
-
234
-
235
-
236
-
237
-
238
-
239
-
240
-
241
-
242
-
243
-
244
-
245
-
246
-
247
-
248
-
249
-
250
-
251
-
252
-
253
-
254
-
255
-
256
-
257
-
258
-
259
-
260
-
261
-
262
-
263
-
264
-
265
-
266
-
267
-
268
-
269
-
270
-
271
-
272
-
273
-
274
-
275
-
276
-
277
-
278
-
279
-
280
-
281
-
282
-
283
-
284
-
285
-
286
-
287
-
288
-
289
-
290
-
291
-
292
-
293
-
294
-
295
-
296
-
297
-
298
-
299
-
300
-
301
-
302
-
303
-
304
 |
 |

Table of Contents
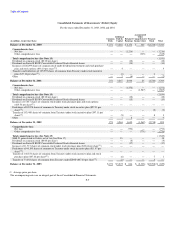
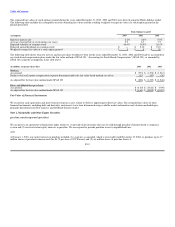
Consolidated Statements of Shareowners' (Deficit) Equity
For the years ended December 31, 2003, 2002 and 2001
Accumulated
Additional Other
Common Paid-In Retained Comprehensive Treasury
(in millions, except share data) Stock Capital Earnings Income (Loss) Stock Total
Balance at December 31, 2000 $ 271 $ 3,264 $ 4,176 $ 360 $(2,728) $ 5,343
Comprehensive loss:
Net loss — — (1,216) — — (1,216)
Other comprehensive loss — — — (335) — (335)
Total comprehensive loss (See Note 13) (1,551)
Dividends on common stock ($0.10 per share) — — (12) — — (12)
Dividends on Series B ESOP Convertible Preferred Stock allocated shares — — (14) — — (14)
Issuance of 126,299 shares of common stock under dividend reinvestment and stock purchase
plan and stock options ($38.10 per share(1)) — 5 — — — 5
Transfers and forfeitures of 105,995 shares of common from Treasury under stock incentive
plan ($37.10 per share(1)) — (4) — — 4 —
Other — 2 (4) — — (2)
Balance at December 31, 2001 271 3,267 2,930 25 (2,724) 3,769
Comprehensive loss:
Net loss — — (1,272) — — (1,272)
Other comprehensive loss — — — (1,587) — (1,587)
Total comprehensive loss (See Note 13) (2,859)
Dividends on common stock ($0.10 per share) — — (12) — — (12)
Dividends on Series B ESOP Convertible Preferred Stock allocated shares — — (15) — — (15)
Issuance of 13,017 shares of common stock under stock purchase plan and stock options
($15.70 per share(1)) — — — — — —
Forfeitures of 82,878 shares of common to Treasury under stock incentive plan ($27.31 per
share(1)) — — — — (2) (2)
Transfer of 183,400 shares of common from Treasury under stock incentive plan ($47.11 per
share(1)) — (5) — — 8 3
Other — 1 8 — — 9
Balance at December 31, 2002 271 3,263 1,639 (1,562) (2,718) 893
Comprehensive loss:
Net loss — — (773) — — (773)
Other comprehensive loss — — — (776) — (776)
Total comprehensive loss (See Note 13) (1,549)
SAB 51 gain related to Orbitz, net of tax (See Note 17) — 18 — — — 18
Dividends on common stock ($0.05 per share) — — (5) — — (5)
Dividends on Series B ESOP Convertible Preferred Stock allocated shares — — (17) — — (17)
Issuance of 11,715 shares of common stock under stock purchase plan ($30.64 per share(1)) — — — — — —
Forfeitures of 44,100 shares of common to Treasury under stock incentive plan ($11.97 per
share(1)) — — — — — —
Transfer of 144,874 shares of common from Treasury under stock incentive plan and stock
purchase plan ($47.22 per share(1)) — (6) — — 7 1
Transfer of 73,252 shares of common from Treasury under ESOP ($47.20 per share(1)) (3) — — 3 —
Balance at December 31, 2003 $ 271 $ 3,272 $ 844 $ (2,338) $(2,708) $ (659)
(1) Average price per share
The accompanying notes are an integral part of these Consolidated Financial Statements.
F-9