Delta Airlines 2003 Annual Report Download - page 85
Download and view the complete annual report
Please find page 85 of the 2003 Delta Airlines annual report below. You can navigate through the pages in the report by either clicking on the pages listed below, or by using the keyword search tool below to find specific information within the annual report.-
 1
1 -
2
-
3
-
4
-
5
-
6
-
7
-
8
-
9
-
10
-
11
-
12
-
13
-
14
-
15
-
16
-
17
-
18
-
19
-
20
-
21
-
22
-
23
-
24
-
25
-
26
-
27
-
28
-
29
-
30
-
31
-
32
-
33
-
34
-
35
-
36
-
37
-
38
-
39
-
40
-
41
-
42
-
43
-
44
-
45
-
46
-
47
-
48
-
49
-
50
-
51
-
52
-
53
-
54
-
55
-
56
-
57
-
58
-
59
-
60
-
61
-
62
-
63
-
64
-
65
-
66
-
67
-
68
-
69
-
70
-
71
-
72
-
73
-
74
-
 75
75 -
 76
76 -
 77
77 -
 78
78 -
 79
79 -
 80
80 -
 81
81 -
 82
82 -
 83
83 -
 84
84 -
 85
85 -
 86
86 -
 87
87 -
 88
88 -
 89
89 -
 90
90 -
 91
91 -
 92
92 -
 93
93 -
 94
94 -
 95
95 -
96
-
97
-
98
-
99
-
100
-
101
-
102
-
103
-
104
-
105
-
106
-
107
-
108
-
109
-
110
-
111
-
112
-
113
-
114
-
115
-
116
-
117
-
118
-
119
-
120
-
121
-
122
-
123
-
124
-
125
-
126
-
127
-
128
-
129
-
130
-
131
-
132
-
133
-
134
-
135
-
136
-
137
-
138
-
139
-
140
-
141
-
142
-
143
-
144
-
145
-
146
-
147
-
148
-
149
-
150
-
151
-
152
-
153
-
154
-
155
-
156
-
157
-
158
-
159
-
160
-
161
-
162
-
163
-
164
-
165
-
166
-
167
-
168
-
169
-
170
-
171
-
172
-
173
-
174
-
175
-
176
-
177
-
178
-
179
-
180
-
181
-
182
-
183
-
184
-
185
-
186
-
187
-
188
-
189
-
190
-
191
-
192
-
193
-
194
-
195
-
196
-
197
-
198
-
199
-
200
-
201
-
202
-
203
-
204
-
205
-
206
-
207
-
208
-
209
-
210
-
211
-
212
-
213
-
214
-
215
-
216
-
217
-
218
-
219
-
220
-
221
-
222
-
223
-
224
-
225
-
226
-
227
-
228
-
229
-
230
-
231
-
232
-
233
-
234
-
235
-
236
-
237
-
238
-
239
-
240
-
241
-
242
-
243
-
244
-
245
-
246
-
247
-
248
-
249
-
250
-
251
-
252
-
253
-
254
-
255
-
256
-
257
-
258
-
259
-
260
-
261
-
262
-
263
-
264
-
265
-
266
-
267
-
268
-
269
-
270
-
271
-
272
-
273
-
274
-
275
-
276
-
277
-
278
-
279
-
280
-
281
-
282
-
283
-
284
-
285
-
286
-
287
-
288
-
289
-
290
-
291
-
292
-
293
-
294
-
295
-
296
-
297
-
298
-
299
-
300
-
301
-
302
-
303
-
304
 |
 |

Table of Contents
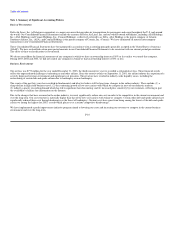
We sell mileage credits in the SkyMiles® frequent flyer program to participating partners such as credit card companies, hotels and car rental agencies. A
portion of the revenue from the sale of mileage credits is deferred until the credits are redeemed for travel. We amortize the deferred revenue on a straight-line
basis over a 30-month period. The majority of the revenue from the sale of mileage credits, including the amortization of deferred revenue, is recorded in
passenger revenue on our Consolidated Statements of Operations; the remaining portion is recorded as an offset to other selling expenses.
Cargo Revenues
Cargo revenues are recognized in our Consolidated Statements of Operations when we provide the transportation.
Other, net
We are party to codeshare agreements with certain airlines. Under these agreements, we sell seats on these airlines' flights and they sell seats on our flights,
with each airline separately marketing its respective seats. The revenue from our sale of codeshare seats flown by other airlines, and the direct costs incurred
in marketing the codeshare flights, are recorded in other, net in operating revenues on our Consolidated Statements of Operations. Our revenue from other
airlines' sale of codeshare seats flown by us is recorded in passenger revenue on our Consolidated Statements of Operations.
We record revenues from our contract carrier agreements, reduced by related expenses, in other, net in operating revenues on our Consolidated Statements of
Operations (see Note 9).
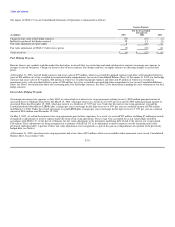
Long-Lived Assets
We record our property and equipment at cost and depreciate or amortize these assets on a straight-line basis to their estimated residual values over their
respective estimated useful lives. Residual values for flight equipment range from 5%-40% of cost. We also capitalize certain internal and external costs
incurred to develop internal-use software; these assets are included in ground property and equipment, net on our Consolidated Balance Sheets. The estimated
useful lives for major asset classifications are as follows:
Estimated
Asset Classification Useful Life
Owned flight equipment 15-25 years
Flight and ground equipment under capital lease Lease Term
Ground property and equipment 3-30 years
In accordance with SFAS 144, we record impairment losses on long-lived assets used in operations when events and circumstances indicate the assets may be
impaired and the undiscounted cash flows estimated to be generated by those assets are less than their carrying amounts. For long-lived assets held for sale,
we record impairment losses when the carrying amount is greater than the fair value less the cost to sell. We discontinue depreciation of long-lived assets once
they are classified as held for sale.
F-15