Delta Airlines 2003 Annual Report Download - page 110
Download and view the complete annual report
Please find page 110 of the 2003 Delta Airlines annual report below. You can navigate through the pages in the report by either clicking on the pages listed below, or by using the keyword search tool below to find specific information within the annual report.-
 1
1 -
2
-
3
-
4
-
5
-
6
-
7
-
8
-
9
-
10
-
11
-
12
-
13
-
14
-
15
-
16
-
17
-
18
-
19
-
20
-
21
-
22
-
23
-
24
-
25
-
26
-
27
-
28
-
29
-
30
-
31
-
32
-
33
-
34
-
35
-
36
-
37
-
38
-
39
-
40
-
41
-
42
-
43
-
44
-
45
-
46
-
47
-
48
-
49
-
50
-
51
-
52
-
53
-
54
-
55
-
56
-
57
-
58
-
59
-
60
-
61
-
62
-
63
-
64
-
65
-
66
-
67
-
68
-
69
-
70
-
71
-
72
-
73
-
74
-
75
-
76
-
77
-
78
-
79
-
80
-
81
-
82
-
83
-
84
-
85
-
86
-
87
-
88
-
89
-
90
-
91
-
92
-
93
-
94
-
95
-
96
-
97
-
98
-
99
-
 100
100 -
 101
101 -
 102
102 -
 103
103 -
 104
104 -
 105
105 -
 106
106 -
 107
107 -
 108
108 -
 109
109 -
 110
110 -
 111
111 -
 112
112 -
 113
113 -
 114
114 -
 115
115 -
 116
116 -
 117
117 -
 118
118 -
 119
119 -
 120
120 -
121
-
122
-
123
-
124
-
125
-
126
-
127
-
128
-
129
-
130
-
131
-
132
-
133
-
134
-
135
-
136
-
137
-
138
-
139
-
140
-
141
-
142
-
143
-
144
-
145
-
146
-
147
-
148
-
149
-
150
-
151
-
152
-
153
-
154
-
155
-
156
-
157
-
158
-
159
-
160
-
161
-
162
-
163
-
164
-
165
-
166
-
167
-
168
-
169
-
170
-
171
-
172
-
173
-
174
-
175
-
176
-
177
-
178
-
179
-
180
-
181
-
182
-
183
-
184
-
185
-
186
-
187
-
188
-
189
-
190
-
191
-
192
-
193
-
194
-
195
-
196
-
197
-
198
-
199
-
200
-
201
-
202
-
203
-
204
-
205
-
206
-
207
-
208
-
209
-
210
-
211
-
212
-
213
-
214
-
215
-
216
-
217
-
218
-
219
-
220
-
221
-
222
-
223
-
224
-
225
-
226
-
227
-
228
-
229
-
230
-
231
-
232
-
233
-
234
-
235
-
236
-
237
-
238
-
239
-
240
-
241
-
242
-
243
-
244
-
245
-
246
-
247
-
248
-
249
-
250
-
251
-
252
-
253
-
254
-
255
-
256
-
257
-
258
-
259
-
260
-
261
-
262
-
263
-
264
-
265
-
266
-
267
-
268
-
269
-
270
-
271
-
272
-
273
-
274
-
275
-
276
-
277
-
278
-
279
-
280
-
281
-
282
-
283
-
284
-
285
-
286
-
287
-
288
-
289
-
290
-
291
-
292
-
293
-
294
-
295
-
296
-
297
-
298
-
299
-
300
-
301
-
302
-
303
-
304
 |
 |

Table of Contents
carryforwards of approximately $4.9 billion, pretax, at December 31, 2003, substantially all of which will not begin to expire until 2022.
In accordance with SFAS 109, deferred tax assets should be reduced by a valuation allowance if it is more likely than not that some portion or all of the
deferred tax assets will not be realized. The future realization of our net deferred tax assets depends on the availability of sufficient future taxable income. In
making this determination, we considered all available positive and negative evidence and made certain assumptions. We considered, among other things, the
overall business environment; our historical earnings, including our significant pretax losses incurred during the last three years; our industry's historically
cyclical periods of earnings and losses; and our outlook for future years.
We performed this analysis as of December 31, 2003 and determined that there was sufficient positive evidence to conclude that it is more likely than not that
our net deferred tax assets will be realized. We will assess the need for a deferred tax asset valuation allowance on an ongoing basis considering factors such
as those mentioned above as well as other relevant criteria. Changes in our assumptions may have a material impact on our Consolidated Financial
Statements.
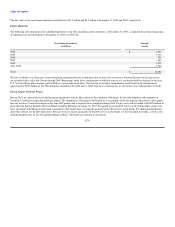
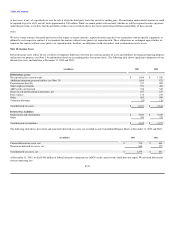
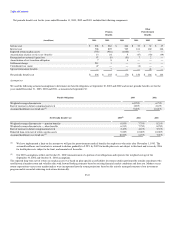
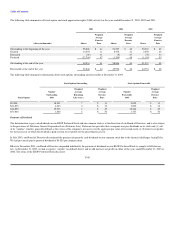
Our income tax benefit for the years ended December 31, 2003, 2002 and 2001 consisted of:
(in millions) 2003 2002 2001
Current tax benefit $ — $ 319 $ —
Deferred tax benefit 411 407 644
Tax benefit of dividends on allocated Series B ESOP Convertible Preferred Stock 5 4 4
Income tax benefit $ 416 $ 730 $ 648
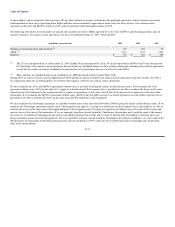
The following table presents the principal reasons for the difference between our effective income tax rate and the U.S. federal statutory income tax rate for
the years ended December 31, 2003, 2002 and 2001:
2003 2002 2001
U.S. federal statutory income tax rate (35.0)% (35.0)% (35.0)%
State taxes, net of federal income tax effect (2.1) (2.4) (2.6)
Meals and entertainment 1.1 0.7 1.0
Amortization — — 1.0
Municipal bond interest — — (0.1)
Increase in valuation allowance 0.8 — 0.8
Other, net 0.2 0.2 0.1
Effective income tax rate (35.0)% (36.5)% (34.8)%
F-39