Delta Airlines 2003 Annual Report Download - page 77
Download and view the complete annual report
Please find page 77 of the 2003 Delta Airlines annual report below. You can navigate through the pages in the report by either clicking on the pages listed below, or by using the keyword search tool below to find specific information within the annual report.-
 1
1 -
2
-
3
-
4
-
5
-
6
-
7
-
8
-
9
-
10
-
11
-
12
-
13
-
14
-
15
-
16
-
17
-
18
-
19
-
20
-
21
-
22
-
23
-
24
-
25
-
26
-
27
-
28
-
29
-
30
-
31
-
32
-
33
-
34
-
35
-
36
-
37
-
38
-
39
-
40
-
41
-
42
-
43
-
44
-
45
-
46
-
47
-
48
-
49
-
50
-
51
-
52
-
53
-
54
-
55
-
56
-
57
-
58
-
59
-
60
-
61
-
62
-
63
-
64
-
65
-
66
-
 67
67 -
 68
68 -
 69
69 -
 70
70 -
 71
71 -
 72
72 -
 73
73 -
 74
74 -
 75
75 -
 76
76 -
 77
77 -
 78
78 -
 79
79 -
 80
80 -
 81
81 -
 82
82 -
 83
83 -
 84
84 -
 85
85 -
 86
86 -
 87
87 -
88
-
89
-
90
-
91
-
92
-
93
-
94
-
95
-
96
-
97
-
98
-
99
-
100
-
101
-
102
-
103
-
104
-
105
-
106
-
107
-
108
-
109
-
110
-
111
-
112
-
113
-
114
-
115
-
116
-
117
-
118
-
119
-
120
-
121
-
122
-
123
-
124
-
125
-
126
-
127
-
128
-
129
-
130
-
131
-
132
-
133
-
134
-
135
-
136
-
137
-
138
-
139
-
140
-
141
-
142
-
143
-
144
-
145
-
146
-
147
-
148
-
149
-
150
-
151
-
152
-
153
-
154
-
155
-
156
-
157
-
158
-
159
-
160
-
161
-
162
-
163
-
164
-
165
-
166
-
167
-
168
-
169
-
170
-
171
-
172
-
173
-
174
-
175
-
176
-
177
-
178
-
179
-
180
-
181
-
182
-
183
-
184
-
185
-
186
-
187
-
188
-
189
-
190
-
191
-
192
-
193
-
194
-
195
-
196
-
197
-
198
-
199
-
200
-
201
-
202
-
203
-
204
-
205
-
206
-
207
-
208
-
209
-
210
-
211
-
212
-
213
-
214
-
215
-
216
-
217
-
218
-
219
-
220
-
221
-
222
-
223
-
224
-
225
-
226
-
227
-
228
-
229
-
230
-
231
-
232
-
233
-
234
-
235
-
236
-
237
-
238
-
239
-
240
-
241
-
242
-
243
-
244
-
245
-
246
-
247
-
248
-
249
-
250
-
251
-
252
-
253
-
254
-
255
-
256
-
257
-
258
-
259
-
260
-
261
-
262
-
263
-
264
-
265
-
266
-
267
-
268
-
269
-
270
-
271
-
272
-
273
-
274
-
275
-
276
-
277
-
278
-
279
-
280
-
281
-
282
-
283
-
284
-
285
-
286
-
287
-
288
-
289
-
290
-
291
-
292
-
293
-
294
-
295
-
296
-
297
-
298
-
299
-
300
-
301
-
302
-
303
-
304
 |
 |
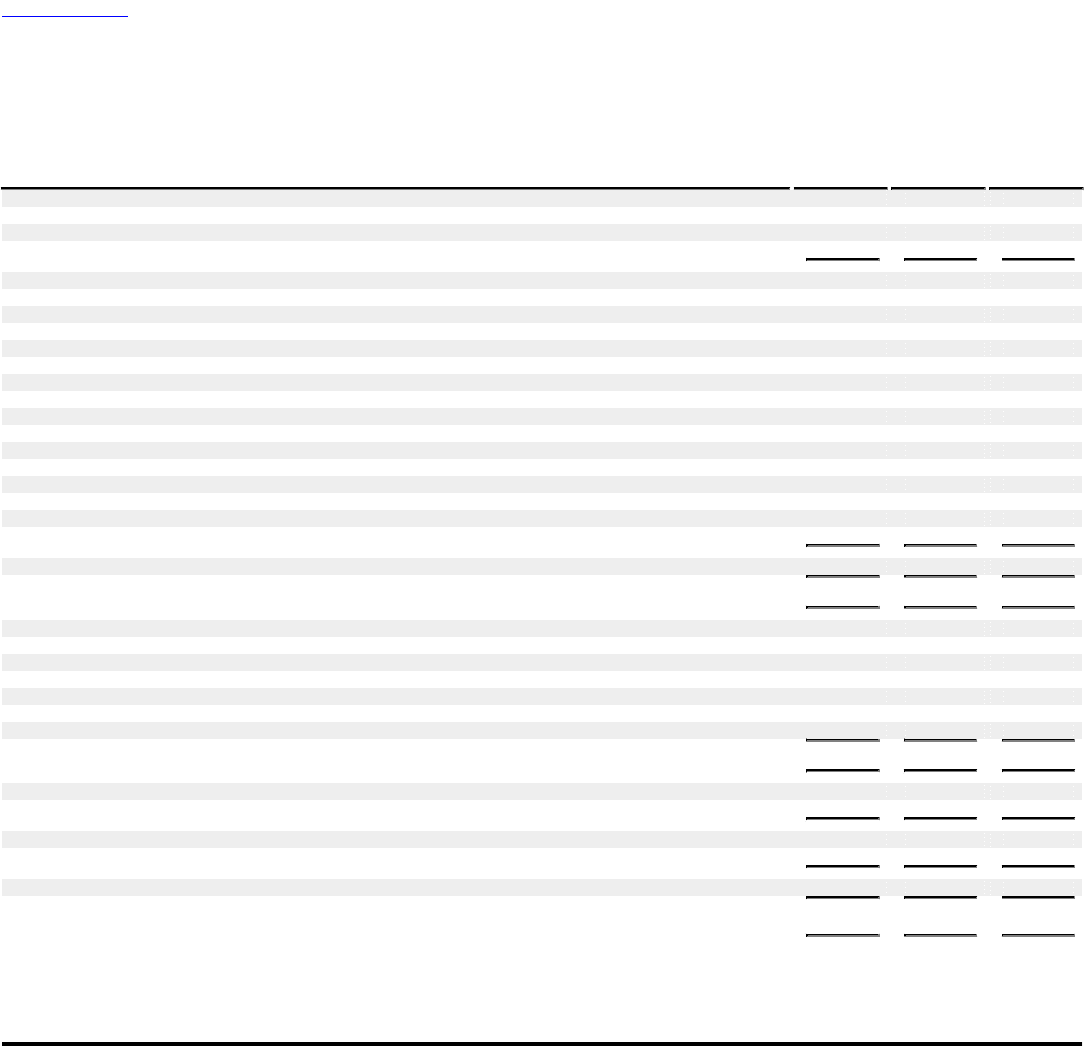
Table of Contents
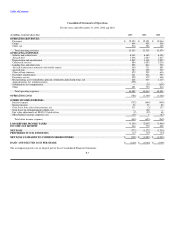
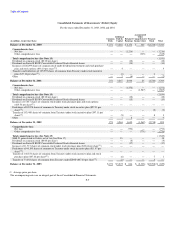
Consolidated Statements of Operations
For the years ended December 31, 2003, 2002 and 2001
(in millions, except per share data) 2003 2002 2001
OPERATING REVENUES:
Passenger $ 12,323 $ 12,321 $ 12,964
Cargo 464 458 506
Other, net 516 526 409
Total operating revenues 13,303 13,305 13,879
OPERATING EXPENSES:
Salaries and related costs 6,342 6,165 6,124
Aircraft fuel 1,938 1,683 1,817
Depreciation and amortization 1,202 1,148 1,283
Contracted services 886 1,003 1,016
Landing fees and other rents 858 834 780
Aircraft maintenance materials and outside repairs 630 711 801
Aircraft rent 727 709 737
Other selling expenses 479 539 616
Passenger commissions 211 322 540
Passenger service 325 372 466
Restructuring, asset writedowns, pension settlements and related items, net 268 439 1,119
Appropriations Act reimbursements (398) — —
Stabilization Act compensation — (34) (634)
Other 621 723 816
Total operating expenses 14,089 14,614 15,481
OPERATING LOSS (786) (1,309) (1,602)
OTHER INCOME (EXPENSE):
Interest expense (732) (646) (499)
Interest income 36 36 89
Gain (loss) from sale of investments, net 321 (3) 127
Gain (loss) on extinguishment of debt, net — (42) —
Fair value adjustments of SFAS 133 derivatives (9) (39) 68
Miscellaneous income (expense), net (19) 1 (47)
Total other income (expense) (403) (693) (262)
LOSS BEFORE INCOME TAXES (1,189) (2,002) (1,864)
INCOME TAX BENEFIT 416 730 648
NET LOSS (773) (1,272) (1,216)
PREFERRED STOCK DIVIDENDS (17) (15) (14)
NET LOSS AVAILABLE TO COMMON SHAREOWNERS $ (790) $ (1,287) $ (1,230)
BASIC AND DILUTED LOSS PER SHARE $ (6.40) $ (10.44) $ (9.99)
The accompanying notes are an integral part of these Consolidated Financial Statements.
F-7