Delta Airlines 2003 Annual Report Download - page 109
Download and view the complete annual report
Please find page 109 of the 2003 Delta Airlines annual report below. You can navigate through the pages in the report by either clicking on the pages listed below, or by using the keyword search tool below to find specific information within the annual report.-
 1
1 -
2
-
3
-
4
-
5
-
6
-
7
-
8
-
9
-
10
-
11
-
12
-
13
-
14
-
15
-
16
-
17
-
18
-
19
-
20
-
21
-
22
-
23
-
24
-
25
-
26
-
27
-
28
-
29
-
30
-
31
-
32
-
33
-
34
-
35
-
36
-
37
-
38
-
39
-
40
-
41
-
42
-
43
-
44
-
45
-
46
-
47
-
48
-
49
-
50
-
51
-
52
-
53
-
54
-
55
-
56
-
57
-
58
-
59
-
60
-
61
-
62
-
63
-
64
-
65
-
66
-
67
-
68
-
69
-
70
-
71
-
72
-
73
-
74
-
75
-
76
-
77
-
78
-
79
-
80
-
81
-
82
-
83
-
84
-
85
-
86
-
87
-
88
-
89
-
90
-
91
-
92
-
93
-
94
-
95
-
96
-
97
-
98
-
 99
99 -
 100
100 -
 101
101 -
 102
102 -
 103
103 -
 104
104 -
 105
105 -
 106
106 -
 107
107 -
 108
108 -
 109
109 -
 110
110 -
 111
111 -
 112
112 -
 113
113 -
 114
114 -
 115
115 -
 116
116 -
 117
117 -
 118
118 -
 119
119 -
120
-
121
-
122
-
123
-
124
-
125
-
126
-
127
-
128
-
129
-
130
-
131
-
132
-
133
-
134
-
135
-
136
-
137
-
138
-
139
-
140
-
141
-
142
-
143
-
144
-
145
-
146
-
147
-
148
-
149
-
150
-
151
-
152
-
153
-
154
-
155
-
156
-
157
-
158
-
159
-
160
-
161
-
162
-
163
-
164
-
165
-
166
-
167
-
168
-
169
-
170
-
171
-
172
-
173
-
174
-
175
-
176
-
177
-
178
-
179
-
180
-
181
-
182
-
183
-
184
-
185
-
186
-
187
-
188
-
189
-
190
-
191
-
192
-
193
-
194
-
195
-
196
-
197
-
198
-
199
-
200
-
201
-
202
-
203
-
204
-
205
-
206
-
207
-
208
-
209
-
210
-
211
-
212
-
213
-
214
-
215
-
216
-
217
-
218
-
219
-
220
-
221
-
222
-
223
-
224
-
225
-
226
-
227
-
228
-
229
-
230
-
231
-
232
-
233
-
234
-
235
-
236
-
237
-
238
-
239
-
240
-
241
-
242
-
243
-
244
-
245
-
246
-
247
-
248
-
249
-
250
-
251
-
252
-
253
-
254
-
255
-
256
-
257
-
258
-
259
-
260
-
261
-
262
-
263
-
264
-
265
-
266
-
267
-
268
-
269
-
270
-
271
-
272
-
273
-
274
-
275
-
276
-
277
-
278
-
279
-
280
-
281
-
282
-
283
-
284
-
285
-
286
-
287
-
288
-
289
-
290
-
291
-
292
-
293
-
294
-
295
-
296
-
297
-
298
-
299
-
300
-
301
-
302
-
303
-
304
 |
 |

Table of Contents
to the excess, if any, of a specified rate over the rate at which the third party leases the aircraft to another party. The maximum undiscounted amount we could
be required to pay for all 11 aircraft totals approximately $70 million. While we cannot predict with certainty whether we will be required to make a payment
under this provision, we believe that the possibility of this event is not likely due to the current and estimated future marketability of these aircraft.
Other
We have certain contracts for goods and services that require us to pay a penalty, acquire inventory specific to us or purchase contract specific equipment, as
defined by each respective contract, if we terminate the contract without cause prior to its expiration date. These obligations are contingent upon whether we
terminate the contract without cause prior to its expiration date; therefore, no obligation would exist unless such a termination were to occur.
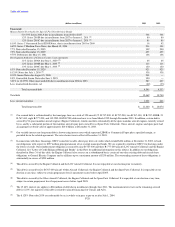
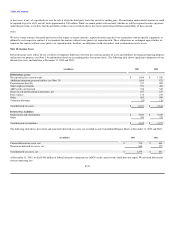
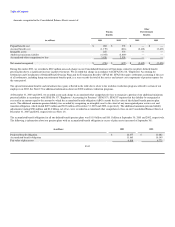
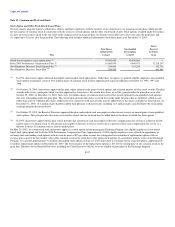
Note 10. Income Taxes
Deferred income taxes reflect the net tax effect of temporary differences between the carrying amounts of assets and liabilities for financial reporting purposes
and income tax purposes (see Note 1 for information about our accounting policy for income taxes). The following table shows significant components of our
deferred tax assets and liabilities at December 31, 2003 and 2002:
(in millions) 2003 2002
Deferred tax assets:
Net operating loss carryforwards $ 1,908 $ 1,256
Additional minimum pension liability (see Note 13) 1,454 972
Postretirement benefits 917 909
Other employee benefits 571 404
AMT credit carryforward 346 349
Gains on sale and leaseback transactions, net 197 217
Rent expense 178 215
Other 465 508
Valuation allowance (25) (16)
Total deferred tax assets $ 6,011 $ 4,814
Deferred tax liabilities:
Depreciation and amortization $ 4,042 $ 3,639
Other 390 332
Total deferred tax liabilities $ 4,432 $ 3,971
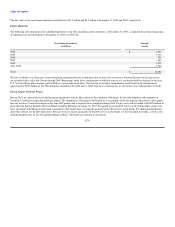
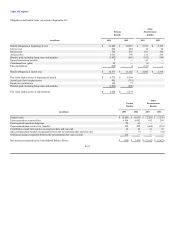
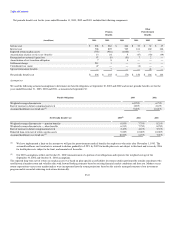
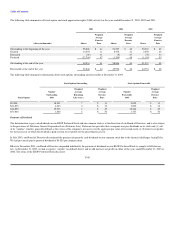
The following table shows the current and noncurrent deferred tax assets, net recorded on our Consolidated Balance Sheets at December 31, 2003 and 2002:
(in millions) 2003 2002
Current deferred tax assets, net $ 710 $ 668
Noncurrent deferred tax assets, net 869 175
Total deferred tax assets, net $ 1,579 $ 843
At December 31, 2003, we had $346 million of federal alternative minimum tax (AMT) credit carryforward, which does not expire. We also had federal and
state net operating loss
F-38