Delta Airlines 2003 Annual Report Download - page 46
Download and view the complete annual report
Please find page 46 of the 2003 Delta Airlines annual report below. You can navigate through the pages in the report by either clicking on the pages listed below, or by using the keyword search tool below to find specific information within the annual report.-
 1
1 -
 2
2 -
 3
3 -
 4
4 -
 5
5 -
 6
6 -
 7
7 -
 8
8 -
 9
9 -
 10
10 -
 11
11 -
 12
12 -
 13
13 -
 14
14 -
 15
15 -
 16
16 -
 17
17 -
 18
18 -
 19
19 -
 20
20 -
 21
21 -
 22
22 -
 23
23 -
 24
24 -
 25
25 -
 26
26 -
 27
27 -
 28
28 -
 29
29 -
 30
30 -
 31
31 -
 32
32 -
 33
33 -
 34
34 -
 35
35 -
 36
36 -
 37
37 -
 38
38 -
 39
39 -
 40
40 -
 41
41 -
 42
42 -
 43
43 -
 44
44 -
 45
45 -
 46
46 -
 47
47 -
 48
48 -
 49
49 -
 50
50 -
 51
51 -
 52
52 -
 53
53 -
 54
54 -
 55
55 -
 56
56 -
 57
57 -
 58
58 -
 59
59 -
 60
60 -
 61
61 -
 62
62 -
 63
63 -
 64
64 -
 65
65 -
 66
66 -
 67
67 -
 68
68 -
 69
69 -
 70
70 -
 71
71 -
 72
72 -
 73
73 -
 74
74 -
 75
75 -
 76
76 -
 77
77 -
 78
78 -
 79
79 -
 80
80 -
 81
81 -
 82
82 -
 83
83 -
 84
84 -
 85
85 -
 86
86 -
 87
87 -
 88
88 -
 89
89 -
 90
90 -
 91
91 -
 92
92 -
 93
93 -
 94
94 -
 95
95 -
 96
96 -
 97
97 -
 98
98 -
 99
99 -
 100
100 -
 101
101 -
 102
102 -
 103
103 -
 104
104 -
 105
105 -
 106
106 -
 107
107 -
 108
108 -
 109
109 -
 110
110 -
 111
111 -
 112
112 -
 113
113 -
 114
114 -
 115
115 -
 116
116 -
 117
117 -
 118
118 -
 119
119 -
 120
120 -
 121
121 -
 122
122 -
 123
123 -
 124
124 -
 125
125 -
 126
126 -
 127
127 -
 128
128 -
 129
129 -
 130
130 -
 131
131 -
 132
132 -
 133
133 -
 134
134 -
 135
135 -
 136
136 -
 137
137 -
 138
138 -
 139
139 -
 140
140 -
 141
141 -
 142
142 -
 143
143 -
 144
144 -
 145
145 -
 146
146 -
 147
147 -
 148
148 -
 149
149 -
 150
150 -
 151
151 -
 152
152 -
 153
153 -
 154
154 -
 155
155 -
 156
156 -
 157
157 -
 158
158 -
 159
159 -
 160
160 -
 161
161 -
 162
162 -
 163
163 -
 164
164 -
 165
165 -
 166
166 -
 167
167 -
 168
168 -
 169
169 -
 170
170 -
 171
171 -
 172
172 -
 173
173 -
 174
174 -
 175
175 -
 176
176 -
 177
177 -
 178
178 -
 179
179 -
 180
180 -
 181
181 -
 182
182 -
 183
183 -
 184
184 -
 185
185 -
 186
186 -
 187
187 -
 188
188 -
 189
189 -
 190
190 -
 191
191 -
 192
192 -
 193
193 -
 194
194 -
 195
195 -
 196
196 -
 197
197 -
 198
198 -
 199
199 -
 200
200 -
 201
201 -
 202
202 -
 203
203 -
 204
204 -
 205
205 -
 206
206 -
 207
207 -
 208
208 -
 209
209 -
 210
210 -
 211
211 -
 212
212 -
 213
213 -
 214
214 -
 215
215 -
 216
216 -
 217
217 -
 218
218 -
 219
219 -
 220
220 -
 221
221 -
 222
222 -
 223
223 -
 224
224 -
 225
225 -
 226
226 -
 227
227 -
 228
228 -
 229
229 -
 230
230 -
 231
231 -
 232
232 -
 233
233 -
 234
234 -
 235
235 -
 236
236 -
 237
237 -
 238
238 -
 239
239 -
 240
240 -
 241
241 -
 242
242 -
 243
243 -
 244
244 -
 245
245 -
 246
246 -
 247
247 -
 248
248 -
 249
249 -
 250
250 -
 251
251 -
 252
252 -
 253
253 -
 254
254 -
 255
255 -
 256
256 -
 257
257 -
 258
258 -
 259
259 -
 260
260 -
 261
261 -
 262
262 -
 263
263 -
 264
264 -
 265
265 -
 266
266 -
 267
267 -
 268
268 -
 269
269 -
 270
270 -
 271
271 -
 272
272 -
 273
273 -
 274
274 -
 275
275 -
 276
276 -
 277
277 -
 278
278 -
 279
279 -
 280
280 -
 281
281 -
 282
282 -
 283
283 -
 284
284 -
 285
285 -
 286
286 -
 287
287 -
 288
288 -
 289
289 -
 290
290 -
 291
291 -
 292
292 -
 293
293 -
 294
294 -
 295
295 -
 296
296 -
 297
297 -
 298
298 -
 299
299 -
 300
300 -
 301
301 -
 302
302 -
 303
303 -
 304
304
 |
 |

Table of Contents
adopted after the September 11 terrorist attacks, that prohibit passenger airlines from transporting mail weighing more than 16 ounces; such mail had
represented approximately 50% of our mail business. The decline in cargo revenues also reflects a 2% decrease due to lower domestic freight volumes and
yields. Cargo ton miles decreased 6% and cargo ton mile yield decreased 4%. Other revenues increased 29% to $526 million, primarily reflecting a 12%
increase due to higher administrative service fees and a 12% increase due to higher codeshare revenues.
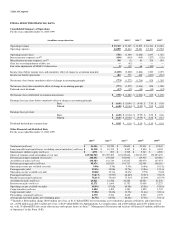
Operating Expenses. Operating expenses totaled $14.6 billion for 2002, decreasing 6% from 2001. Operating capacity decreased 4% to 142 billion ASMs.
CASM fell 2% to 10.31¢. Operating expenses and CASM reflect in 2002 and 2001 (1) restructuring, asset writedowns, pension settlements and related items,
net and (2) Stabilization Act compensation. These items are discussed below.
Salaries and related costs totaled $6.2 billion in 2002, a 1% increase from 2001. This reflects a 6% increase from higher pension expense and a 5%
increase due to salary and benefit rate increases for pilots and mechanics in the June 2002 quarter. These increases were largely offset by decreases due to
workforce reductions implemented after we reduced capacity following September 11, 2001.
Aircraft fuel expense totaled $1.7 billion during 2002, a 7% decrease from 2001. Total gallons consumed decreased 5% mainly due to capacity reductions.
The average fuel price per gallon fell 2% to 66.94¢. Our fuel cost is shown net of fuel hedge gains of $136 million for 2002 and $299 million for 2001.
Approximately 56% and 58% of our aircraft fuel requirements were hedged during 2002 and 2001, respectively. For additional information about our fuel
hedge contracts, see Note 4 of the Notes to the Consolidated Financial Statements.
Depreciation and amortization expense fell 11% in 2002, reflecting a 6% decrease due to a change in our asset base and a 5% decrease due to our adoption
on January 1, 2002, of SFAS No. 142, "Goodwill and Other Intangible Assets" ("SFAS 142"). SFAS 142 requires that goodwill and certain other intangible
assets no longer be amortized (see Note 5 of the Notes to the Consolidated Financial Statements).
Contracted services expense declined 1% primarily due to a 4% decrease from fewer contract workers, partially offset by a 3% increase due to higher
security costs. Landing fees and other rents rose 7%, of which 3% was related to an increase in landing fee rates and 2% was due to lower costs in 2001
resulting from reduced operations by Comair. Due to a strike by its pilots, Comair suspended operations between March 26, 2001 and July 1, 2001, and
gradually returned to service after the strike.
Aircraft maintenance materials and outside repairs expense fell 11%, primarily reflecting a reduction in maintenance volume and materials consumption
due to the timing of maintenance events. Aircraft rent expense decreased 4%, primarily due to a reduction in the number of leased aircraft during 2002 from
our fleet simplification efforts. Other selling expenses fell 13%, of which 6% was due to lower costs associated with our mileage partnership programs and
4% was due to reduced advertising and promotion spending.
39
