Delta Airlines 2003 Annual Report Download - page 114
Download and view the complete annual report
Please find page 114 of the 2003 Delta Airlines annual report below. You can navigate through the pages in the report by either clicking on the pages listed below, or by using the keyword search tool below to find specific information within the annual report.-
 1
1 -
2
-
3
-
4
-
5
-
6
-
7
-
8
-
9
-
10
-
11
-
12
-
13
-
14
-
15
-
16
-
17
-
18
-
19
-
20
-
21
-
22
-
23
-
24
-
25
-
26
-
27
-
28
-
29
-
30
-
31
-
32
-
33
-
34
-
35
-
36
-
37
-
38
-
39
-
40
-
41
-
42
-
43
-
44
-
45
-
46
-
47
-
48
-
49
-
50
-
51
-
52
-
53
-
54
-
55
-
56
-
57
-
58
-
59
-
60
-
61
-
62
-
63
-
64
-
65
-
66
-
67
-
68
-
69
-
70
-
71
-
72
-
73
-
74
-
75
-
76
-
77
-
78
-
79
-
80
-
81
-
82
-
83
-
84
-
85
-
86
-
87
-
88
-
89
-
90
-
91
-
92
-
93
-
94
-
95
-
96
-
97
-
98
-
99
-
100
-
101
-
102
-
103
-
 104
104 -
 105
105 -
 106
106 -
 107
107 -
 108
108 -
 109
109 -
 110
110 -
 111
111 -
 112
112 -
 113
113 -
 114
114 -
 115
115 -
 116
116 -
 117
117 -
 118
118 -
 119
119 -
 120
120 -
 121
121 -
 122
122 -
 123
123 -
 124
124 -
125
-
126
-
127
-
128
-
129
-
130
-
131
-
132
-
133
-
134
-
135
-
136
-
137
-
138
-
139
-
140
-
141
-
142
-
143
-
144
-
145
-
146
-
147
-
148
-
149
-
150
-
151
-
152
-
153
-
154
-
155
-
156
-
157
-
158
-
159
-
160
-
161
-
162
-
163
-
164
-
165
-
166
-
167
-
168
-
169
-
170
-
171
-
172
-
173
-
174
-
175
-
176
-
177
-
178
-
179
-
180
-
181
-
182
-
183
-
184
-
185
-
186
-
187
-
188
-
189
-
190
-
191
-
192
-
193
-
194
-
195
-
196
-
197
-
198
-
199
-
200
-
201
-
202
-
203
-
204
-
205
-
206
-
207
-
208
-
209
-
210
-
211
-
212
-
213
-
214
-
215
-
216
-
217
-
218
-
219
-
220
-
221
-
222
-
223
-
224
-
225
-
226
-
227
-
228
-
229
-
230
-
231
-
232
-
233
-
234
-
235
-
236
-
237
-
238
-
239
-
240
-
241
-
242
-
243
-
244
-
245
-
246
-
247
-
248
-
249
-
250
-
251
-
252
-
253
-
254
-
255
-
256
-
257
-
258
-
259
-
260
-
261
-
262
-
263
-
264
-
265
-
266
-
267
-
268
-
269
-
270
-
271
-
272
-
273
-
274
-
275
-
276
-
277
-
278
-
279
-
280
-
281
-
282
-
283
-
284
-
285
-
286
-
287
-
288
-
289
-
290
-
291
-
292
-
293
-
294
-
295
-
296
-
297
-
298
-
299
-
300
-
301
-
302
-
303
-
304
 |
 |

Table of Contents
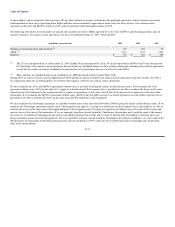
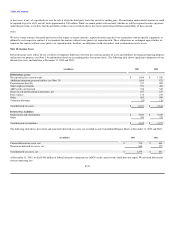
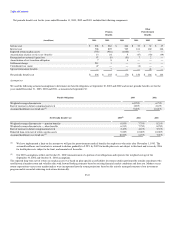
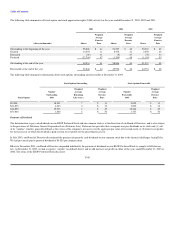
Net periodic benefit cost for the years ended December 31, 2003, 2002 and 2001, included the following components:
Other
Pension Postretirement
Benefits Benefits
(in millions) 2003 2002 2001 2003 2002 2001
Service cost $ 238 $ 282 $ 246 $ 33 $ 30 $ 37
Interest cost 768 825 763 161 160 146
Expected return on plan assets (753) (984) (1,040) — — —
Amortization of prior service cost (benefit) 13 24 5 (47) (50) (39)
Recognized net actuarial (gain) loss 97 (8) (51) 7 2 —
Amortization of net transition obligation 7 8 4 — — —
Settlement charge 219 1 — — — —
Curtailment loss (gain) 47 — — (4) — —
Special termination benefits — 7 — — 44 —
Net periodic benefit cost $ 636 $ 155 $ (73) $ 150 $ 186 $ 144
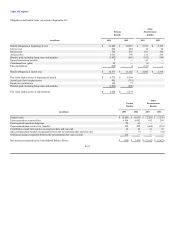
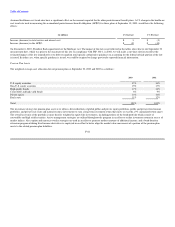
Assumptions
We used the following actuarial assumptions to determine our benefit obligations at September 30, 2003 and 2002 and our net periodic benefit cost for the
years ended December 31, 2003, 2002 and 2001, as measured at September 30:
Benefit Obligations 2003 2002
Weighted average discount rate 6.125% 6.75%
Rate of increase in future compensation levels 1.89% 2.67%
Assumed healthcare cost trend rate(1) 9.00% 10.00%
Net Periodic Benefit Cost 2003(2) 2002 2001
Weighted average discount rate — pension benefits 6.83% 7.75% 8.25%
Weighted average discount rate — other benefits 6.91% 7.75% 8.25%
Rate of increase in future compensation levels 2.47% 4.67% 5.35%
Expected long-term rate of return on plan assets 9.00% 10.00% 10.00%
Assumed healthcare cost trend rate(1) 10.00% 6.25% 7.00%
(1)
We have implemented a limit on the amount we will pay for postretirement medical benefits for employees who retire after November 1, 1993. The
assumed healthcare cost trend rate is assumed to decline gradually to 5.25% by 2007 for health plan costs not subject to this limit and to zero by 2006
for health plan costs subject to the limit, and remain level thereafter.
(2)
Our 2003 assumptions reflect our October 31, 2002 remeasurement of a portion of our obligations and represent the weighted average of the
September 30, 2002 and October 31, 2002 assumptions.
The expected long-term rate of return on our plan assets was based on plan-specific asset/liability investment studies performed by outside consultants who
used historical market return and volatility data with forward looking estimates based on existing financial market conditions and forecasts. Modest excess
return expectations versus some market indices were incorporated into the return projections based on the actively managed structure of our investment
program and its record of achieving such returns historically.
F-43