Delta Airlines 2003 Annual Report Download - page 78
Download and view the complete annual report
Please find page 78 of the 2003 Delta Airlines annual report below. You can navigate through the pages in the report by either clicking on the pages listed below, or by using the keyword search tool below to find specific information within the annual report.-
 1
1 -
2
-
3
-
4
-
5
-
6
-
7
-
8
-
9
-
10
-
11
-
12
-
13
-
14
-
15
-
16
-
17
-
18
-
19
-
20
-
21
-
22
-
23
-
24
-
25
-
26
-
27
-
28
-
29
-
30
-
31
-
32
-
33
-
34
-
35
-
36
-
37
-
38
-
39
-
40
-
41
-
42
-
43
-
44
-
45
-
46
-
47
-
48
-
49
-
50
-
51
-
52
-
53
-
54
-
55
-
56
-
57
-
58
-
59
-
60
-
61
-
62
-
63
-
64
-
65
-
66
-
67
-
 68
68 -
 69
69 -
 70
70 -
 71
71 -
 72
72 -
 73
73 -
 74
74 -
 75
75 -
 76
76 -
 77
77 -
 78
78 -
 79
79 -
 80
80 -
 81
81 -
 82
82 -
 83
83 -
 84
84 -
 85
85 -
 86
86 -
 87
87 -
 88
88 -
89
-
90
-
91
-
92
-
93
-
94
-
95
-
96
-
97
-
98
-
99
-
100
-
101
-
102
-
103
-
104
-
105
-
106
-
107
-
108
-
109
-
110
-
111
-
112
-
113
-
114
-
115
-
116
-
117
-
118
-
119
-
120
-
121
-
122
-
123
-
124
-
125
-
126
-
127
-
128
-
129
-
130
-
131
-
132
-
133
-
134
-
135
-
136
-
137
-
138
-
139
-
140
-
141
-
142
-
143
-
144
-
145
-
146
-
147
-
148
-
149
-
150
-
151
-
152
-
153
-
154
-
155
-
156
-
157
-
158
-
159
-
160
-
161
-
162
-
163
-
164
-
165
-
166
-
167
-
168
-
169
-
170
-
171
-
172
-
173
-
174
-
175
-
176
-
177
-
178
-
179
-
180
-
181
-
182
-
183
-
184
-
185
-
186
-
187
-
188
-
189
-
190
-
191
-
192
-
193
-
194
-
195
-
196
-
197
-
198
-
199
-
200
-
201
-
202
-
203
-
204
-
205
-
206
-
207
-
208
-
209
-
210
-
211
-
212
-
213
-
214
-
215
-
216
-
217
-
218
-
219
-
220
-
221
-
222
-
223
-
224
-
225
-
226
-
227
-
228
-
229
-
230
-
231
-
232
-
233
-
234
-
235
-
236
-
237
-
238
-
239
-
240
-
241
-
242
-
243
-
244
-
245
-
246
-
247
-
248
-
249
-
250
-
251
-
252
-
253
-
254
-
255
-
256
-
257
-
258
-
259
-
260
-
261
-
262
-
263
-
264
-
265
-
266
-
267
-
268
-
269
-
270
-
271
-
272
-
273
-
274
-
275
-
276
-
277
-
278
-
279
-
280
-
281
-
282
-
283
-
284
-
285
-
286
-
287
-
288
-
289
-
290
-
291
-
292
-
293
-
294
-
295
-
296
-
297
-
298
-
299
-
300
-
301
-
302
-
303
-
304
 |
 |

Table of Contents
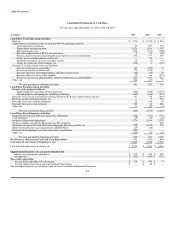
Consolidated Statements of Cash Flows
For the years ended December 31, 2003, 2002 and 2001
(in millions) 2003 2002 2001
Cash Flows From Operating Activities:
Net loss $ (773) $ (1,272) $ (1,216)
Adjustments to reconcile net loss to cash provided by operating activities:
Asset and other writedowns 47 287 339
Depreciation and amortization 1,230 1,181 1,283
Deferred income taxes (416) (411) (648)
Fair value adjustments of SFAS 133 derivatives 9 39 (68)
Pension, postretirement and postemployment expense in excess of payments 532 177 419
(Gain) loss on extinguishment of debt, net — 42 —
Dividends (less than) in excess of equity income 30 (3) 51
(Gain) loss from sale of investments, net (321) 3 (127)
Changes in certain current assets and liabilities:
Decrease (increase) in receivables 317 (243) 47
Increase in current restricted cash (73) (134) —
(Increase) decrease in prepaid expenses and other current assets (90) (35) 60
Increase (decrease) in air traffic liability 38 46 (215)
(Decrease) increase in other payables, deferred credits and accrued liabilities (301) 675 274
Other, net 224 (67) 37
Net cash provided by operating activities 453 285 236
Cash Flows From Investing Activities:
Property and equipment additions:
Flight equipment, including advance payments (382) (922) (2,321)
Ground property and equipment, including technology (362) (364) (472)
Decrease (increase) in restricted investments related to the Boston airport terminal project 131 58 (485)
Decrease in short-term investments, net — 5 238
Proceeds from sales of flight equipment 15 100 66
Proceeds from sales of investments 325 24 286
Other, net 13 (10) (8)
Net cash used in investing activities (260) (1,109) (2,696)
Cash Flows From Financing Activities:
Payments on long-term debt and capital lease obligations (650) (734) (173)
Cash dividends (19) (39) (40)
Issuance of long-term obligations 1,774 2,554 2,335
Issuance of long-term debt by Massachusetts Port Authority — — 498
(Payments on) proceeds from short term obligations and notes payable, net (152) (1,144) 701
Make-whole payments on extinguishment of ESOP Notes (15) (42) —
Payment on termination of accounts receivable securitization (250) — —
Other, net (140) (12) (15)
Net cash provided by financing activities 548 583 3,306
Net (Decrease) Increase In Cash and Cash Equivalents 741 (241) 846
Cash and cash equivalents at beginning of year 1,969 2,210 1,364
Cash and cash equivalents at end of year $ 2,710 $ 1,969 $ 2,210
Supplemental disclosure of cash paid (refunded) for:
Interest, net of amounts capitalized $ 715 $ 569 $ 490
Income taxes $ (402) $ (649) $ (103)
Non-cash transactions:
Aircraft delivered under seller-financing $ 718 $ 705 $ 77
Aircraft capital leases from sale and leaseback transactions $ — $ 52 $ —
The accompanying notes are an integral part of these Consolidated Financial Statements.
F-8