Delta Airlines 2003 Annual Report Download - page 123
Download and view the complete annual report
Please find page 123 of the 2003 Delta Airlines annual report below. You can navigate through the pages in the report by either clicking on the pages listed below, or by using the keyword search tool below to find specific information within the annual report.-
 1
1 -
2
-
3
-
4
-
5
-
6
-
7
-
8
-
9
-
10
-
11
-
12
-
13
-
14
-
15
-
16
-
17
-
18
-
19
-
20
-
21
-
22
-
23
-
24
-
25
-
26
-
27
-
28
-
29
-
30
-
31
-
32
-
33
-
34
-
35
-
36
-
37
-
38
-
39
-
40
-
41
-
42
-
43
-
44
-
45
-
46
-
47
-
48
-
49
-
50
-
51
-
52
-
53
-
54
-
55
-
56
-
57
-
58
-
59
-
60
-
61
-
62
-
63
-
64
-
65
-
66
-
67
-
68
-
69
-
70
-
71
-
72
-
73
-
74
-
75
-
76
-
77
-
78
-
79
-
80
-
81
-
82
-
83
-
84
-
85
-
86
-
87
-
88
-
89
-
90
-
91
-
92
-
93
-
94
-
95
-
96
-
97
-
98
-
99
-
100
-
101
-
102
-
103
-
104
-
105
-
106
-
107
-
108
-
109
-
110
-
111
-
112
-
 113
113 -
 114
114 -
 115
115 -
 116
116 -
 117
117 -
 118
118 -
 119
119 -
 120
120 -
 121
121 -
 122
122 -
 123
123 -
 124
124 -
 125
125 -
 126
126 -
 127
127 -
 128
128 -
 129
129 -
 130
130 -
 131
131 -
 132
132 -
 133
133 -
134
-
135
-
136
-
137
-
138
-
139
-
140
-
141
-
142
-
143
-
144
-
145
-
146
-
147
-
148
-
149
-
150
-
151
-
152
-
153
-
154
-
155
-
156
-
157
-
158
-
159
-
160
-
161
-
162
-
163
-
164
-
165
-
166
-
167
-
168
-
169
-
170
-
171
-
172
-
173
-
174
-
175
-
176
-
177
-
178
-
179
-
180
-
181
-
182
-
183
-
184
-
185
-
186
-
187
-
188
-
189
-
190
-
191
-
192
-
193
-
194
-
195
-
196
-
197
-
198
-
199
-
200
-
201
-
202
-
203
-
204
-
205
-
206
-
207
-
208
-
209
-
210
-
211
-
212
-
213
-
214
-
215
-
216
-
217
-
218
-
219
-
220
-
221
-
222
-
223
-
224
-
225
-
226
-
227
-
228
-
229
-
230
-
231
-
232
-
233
-
234
-
235
-
236
-
237
-
238
-
239
-
240
-
241
-
242
-
243
-
244
-
245
-
246
-
247
-
248
-
249
-
250
-
251
-
252
-
253
-
254
-
255
-
256
-
257
-
258
-
259
-
260
-
261
-
262
-
263
-
264
-
265
-
266
-
267
-
268
-
269
-
270
-
271
-
272
-
273
-
274
-
275
-
276
-
277
-
278
-
279
-
280
-
281
-
282
-
283
-
284
-
285
-
286
-
287
-
288
-
289
-
290
-
291
-
292
-
293
-
294
-
295
-
296
-
297
-
298
-
299
-
300
-
301
-
302
-
303
-
304
 |
 |

Table of Contents
evaluated regularly by the chief operating decision-maker and is used in resource allocation and performance assessments.
We are managed as a single business unit that provides air transportation for passengers and cargo. This allows us to benefit from an integrated revenue
pricing and route network that includes Delta-Mainline (including Song), ASA and Comair. The flight equipment of all three carriers is combined to form one
fleet which is deployed through a single route scheduling system. When making resource allocation decisions, our chief operating decision maker evaluates
flight profitability data, which considers aircraft type and route economics, but gives no weight to the financial impact of the resource allocation decision on
an individual carrier basis. Our objective in making resource allocation decisions is to maximize our consolidated financial results, not the individual results
of Delta-Mainline (including Song), ASA and Comair.
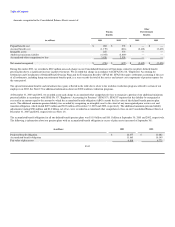
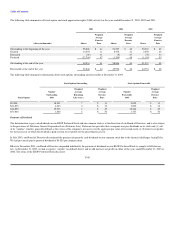
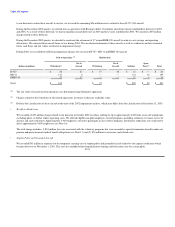
Operating revenues are assigned to a specific geographic region based on the origin, flight path and destination of each flight segment. Our operating revenues
by geographic region for the years ended December 31, 2003, 2002 and 2001 are summarized in the following table:
(in millions) 2003 2002 2001
North America $ 10,891 $ 10,778 $ 11,288
Atlantic 1,770 1,860 1,823
Pacific 107 127 222
Latin America 535 540 546
Total $ 13,303 $ 13,305 $ 13,879
Our tangible assets consist primarily of flight equipment which is mobile across geographic markets. Accordingly, assets are not allocated to specific
geographic regions.
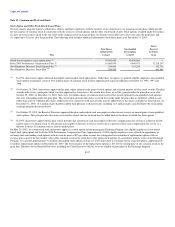
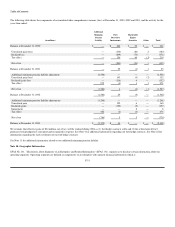
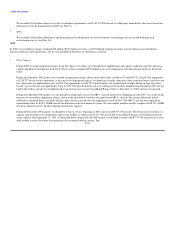
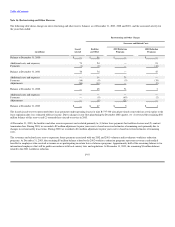
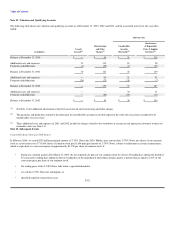
Note 15. Restructuring, Asset Writedowns, Pension Settlements and Related Items, Net
2003
In 2003, we recorded net charges totaling $268 million ($169 million net of tax, or $1.37 diluted earnings per share) in restructuring, asset writedowns,
pension settlements and related items, net on our Consolidated Statement of Operations, as follows:
• Pension Settlement
We recorded a $212 million non-cash charge related to our pilots' defined benefit pension plan due to a significant increase in pilot retirements (see
Note 11).
• Pension and Postretirement Curtailment
We recorded a $43 million net charge for costs associated with the 2002 workforce reduction program. This charge relates to a net curtailment loss
under certain of our pension and postretirement medical benefit plans (see Note 11). See below for additional information about our 2002 workforce
reduction programs.
• Planned Sale of Aircraft F-52