Delta Airlines 2003 Annual Report Download - page 36
Download and view the complete annual report
Please find page 36 of the 2003 Delta Airlines annual report below. You can navigate through the pages in the report by either clicking on the pages listed below, or by using the keyword search tool below to find specific information within the annual report.-
 1
1 -
2
-
3
-
4
-
5
-
6
-
7
-
8
-
9
-
10
-
11
-
12
-
13
-
14
-
15
-
16
-
17
-
18
-
19
-
20
-
21
-
22
-
23
-
24
-
25
-
 26
26 -
 27
27 -
 28
28 -
 29
29 -
 30
30 -
 31
31 -
 32
32 -
 33
33 -
 34
34 -
 35
35 -
 36
36 -
 37
37 -
 38
38 -
 39
39 -
 40
40 -
 41
41 -
 42
42 -
 43
43 -
 44
44 -
 45
45 -
 46
46 -
47
-
48
-
49
-
50
-
51
-
52
-
53
-
54
-
55
-
56
-
57
-
58
-
59
-
60
-
61
-
62
-
63
-
64
-
65
-
66
-
67
-
68
-
69
-
70
-
71
-
72
-
73
-
74
-
75
-
76
-
77
-
78
-
79
-
80
-
81
-
82
-
83
-
84
-
85
-
86
-
87
-
88
-
89
-
90
-
91
-
92
-
93
-
94
-
95
-
96
-
97
-
98
-
99
-
100
-
101
-
102
-
103
-
104
-
105
-
106
-
107
-
108
-
109
-
110
-
111
-
112
-
113
-
114
-
115
-
116
-
117
-
118
-
119
-
120
-
121
-
122
-
123
-
124
-
125
-
126
-
127
-
128
-
129
-
130
-
131
-
132
-
133
-
134
-
135
-
136
-
137
-
138
-
139
-
140
-
141
-
142
-
143
-
144
-
145
-
146
-
147
-
148
-
149
-
150
-
151
-
152
-
153
-
154
-
155
-
156
-
157
-
158
-
159
-
160
-
161
-
162
-
163
-
164
-
165
-
166
-
167
-
168
-
169
-
170
-
171
-
172
-
173
-
174
-
175
-
176
-
177
-
178
-
179
-
180
-
181
-
182
-
183
-
184
-
185
-
186
-
187
-
188
-
189
-
190
-
191
-
192
-
193
-
194
-
195
-
196
-
197
-
198
-
199
-
200
-
201
-
202
-
203
-
204
-
205
-
206
-
207
-
208
-
209
-
210
-
211
-
212
-
213
-
214
-
215
-
216
-
217
-
218
-
219
-
220
-
221
-
222
-
223
-
224
-
225
-
226
-
227
-
228
-
229
-
230
-
231
-
232
-
233
-
234
-
235
-
236
-
237
-
238
-
239
-
240
-
241
-
242
-
243
-
244
-
245
-
246
-
247
-
248
-
249
-
250
-
251
-
252
-
253
-
254
-
255
-
256
-
257
-
258
-
259
-
260
-
261
-
262
-
263
-
264
-
265
-
266
-
267
-
268
-
269
-
270
-
271
-
272
-
273
-
274
-
275
-
276
-
277
-
278
-
279
-
280
-
281
-
282
-
283
-
284
-
285
-
286
-
287
-
288
-
289
-
290
-
291
-
292
-
293
-
294
-
295
-
296
-
297
-
298
-
299
-
300
-
301
-
302
-
303
-
304
 |
 |
Table of Contents
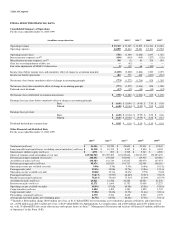
ITEM 6. SELECTED FINANCIAL DATA
Consolidated Summary of Operations
For the years ended December 31, 2003-1999
(in millions, except share data) 2003(1) 2002(2) 2001(3) 2000(4) 1999(5)
Operating revenues $ 13,303 $ 13,305 $ 13,879 $ 16,741 $ 14,883
Operating expenses 14,089 14,614 15,481 15,104 13,565
Operating income (loss) (786) (1,309) (1,602) 1,637 1,318
Interest income (expense), net(6) (696) (610) (410) (257) (126)
Miscellaneous income (expense), net(7) 302 (2) 80 328 901
Gain loss on extinguishment of debt, net — (42) — — —
Fair value adjustments of SFAS 133 derivatives (9) (39) 68 (159) —
Income (loss) before income taxes and cumulative effect of change in accounting principle (1,189) (2,002) (1,864) 1,549 2,093
Income tax benefit (provision) 416 730 648 (621) (831)
Net income (loss) before cumulative effect of change in accounting principle (773) (1,272) (1,216) 928 1,262
Net income (loss) after cumulative effect of change in accounting principle (773) (1,272) (1,216) 828 1,208
Preferred stock dividends (17) (15) (14) (13) (12)
Net Income (loss) attributable to common shareowners $ (790) $ (1,287) $ (1,230) $ 815 $ 1,196
Earnings (loss) per share before cumulative effect of change in accounting principle
Basic $ (6.40) $ (10.44) $ (9.99) $ 7.39 $ 9.05
Diluted $ (6.40) $ (10.44) $ (9.99) $ 7.05 $ 8.52
Earnings (loss) per share
Basic $ (6.40) $ (10.44) $ (9.99) $ 6.58 $ 8.66
Diluted $ (6.40) $ (10.44) $ (9.99) $ 6.28 $ 8.15
Dividends declared per common share $ 0.05 $ 0.10 $ 0.10 $ 0.10 $ 0.10
Other Financial and Statistical Data
For the years ended December 31, 2003-1999
2003(1) 2002(2) 2001(3) 2000(4) 1999(5)
Total assets (millions) $ 26,356 $ 24,720 $ 23,605 $ 21,931 $ 19,942
Long-term debt and capital leases (excluding current maturities) (millions) $ 11,538 $ 10,174 $ 8,347 $ 5,896 $ 4,303
Shareowners' (deficit) equity (millions) $ (659) $ 893 $ 3,769 $ 5,343 $ 4,908
Shares of common stock outstanding at year end 123,544,945 123,359,205 123,245,666 123,013,372 132,893,470
Revenue passengers enplaned (thousands) 104,452 107,048 104,943 119,930 110,083
Available seat miles (millions) 134,383 141,719 147,837 154,974 147,073
Revenue passenger miles (millions) 98,674 102,029 101,717 112,998 106,165
Operating revenue per available seat mile 9.90¢ 9.39¢ 9.39¢ 10.80¢ 10.12¢
Passenger mile yield 12.49¢ 12.08¢ 12.74¢ 13.86¢ 13.14¢
Operating cost per available seat mile 10.48¢ 10.31¢ 10.47¢ 9.75¢ 9.22¢
Passenger load factor 73.43% 71.99% 68.80% 72.91% 72.18%
Breakeven passenger load factor 78.11% 79.64% 77.31% 65.29% 65.37%
Available ton miles (millions) 20,421 21,548 22,282 22,925 21,245
Revenue ton miles (millions) 11,271 11,698 11,752 13,058 12,227
Operating cost per available ton miles 68.99¢ 67.82¢ 69.48¢ 65.88¢ 63.85¢
Cargo ton miles (millions) 1,404 1,495 1,583 1,855 1,747
Cargo ton mile yield 33.08¢ 30.62¢ 31.95¢ 31.46¢ 32.10¢
Fuel gallons consumed (millions) 2,370 2,514 2,649 2,922 2,779
Average price per fuel gallon, net of hedging gains 81.78¢ 66.94¢ 68.60¢ 67.38¢ 51.13¢
(1) Includes a $268 million charge ($169 million net of tax, or $1.37 diluted EPS) for restructuring, asset writedowns, pension settlements and related items,
net; a $398 million gain ($251 million net of tax, or $2.03 diluted EPS) for Appropriations Act compensation; and a $304 million gain ($191 million net of
tax, or $1.55 diluted EPS) for certain other income and expense items (see Item 7. "Management's Discussion and Analysis of Financial Condition and Results
of Operations" in this Form 10-K).