Delta Airlines 2003 Annual Report Download - page 76
Download and view the complete annual report
Please find page 76 of the 2003 Delta Airlines annual report below. You can navigate through the pages in the report by either clicking on the pages listed below, or by using the keyword search tool below to find specific information within the annual report.-
 1
1 -
2
-
3
-
4
-
5
-
6
-
7
-
8
-
9
-
10
-
11
-
12
-
13
-
14
-
15
-
16
-
17
-
18
-
19
-
20
-
21
-
22
-
23
-
24
-
25
-
26
-
27
-
28
-
29
-
30
-
31
-
32
-
33
-
34
-
35
-
36
-
37
-
38
-
39
-
40
-
41
-
42
-
43
-
44
-
45
-
46
-
47
-
48
-
49
-
50
-
51
-
52
-
53
-
54
-
55
-
56
-
57
-
58
-
59
-
60
-
61
-
62
-
63
-
64
-
65
-
 66
66 -
 67
67 -
 68
68 -
 69
69 -
 70
70 -
 71
71 -
 72
72 -
 73
73 -
 74
74 -
 75
75 -
 76
76 -
 77
77 -
 78
78 -
 79
79 -
 80
80 -
 81
81 -
 82
82 -
 83
83 -
 84
84 -
 85
85 -
 86
86 -
87
-
88
-
89
-
90
-
91
-
92
-
93
-
94
-
95
-
96
-
97
-
98
-
99
-
100
-
101
-
102
-
103
-
104
-
105
-
106
-
107
-
108
-
109
-
110
-
111
-
112
-
113
-
114
-
115
-
116
-
117
-
118
-
119
-
120
-
121
-
122
-
123
-
124
-
125
-
126
-
127
-
128
-
129
-
130
-
131
-
132
-
133
-
134
-
135
-
136
-
137
-
138
-
139
-
140
-
141
-
142
-
143
-
144
-
145
-
146
-
147
-
148
-
149
-
150
-
151
-
152
-
153
-
154
-
155
-
156
-
157
-
158
-
159
-
160
-
161
-
162
-
163
-
164
-
165
-
166
-
167
-
168
-
169
-
170
-
171
-
172
-
173
-
174
-
175
-
176
-
177
-
178
-
179
-
180
-
181
-
182
-
183
-
184
-
185
-
186
-
187
-
188
-
189
-
190
-
191
-
192
-
193
-
194
-
195
-
196
-
197
-
198
-
199
-
200
-
201
-
202
-
203
-
204
-
205
-
206
-
207
-
208
-
209
-
210
-
211
-
212
-
213
-
214
-
215
-
216
-
217
-
218
-
219
-
220
-
221
-
222
-
223
-
224
-
225
-
226
-
227
-
228
-
229
-
230
-
231
-
232
-
233
-
234
-
235
-
236
-
237
-
238
-
239
-
240
-
241
-
242
-
243
-
244
-
245
-
246
-
247
-
248
-
249
-
250
-
251
-
252
-
253
-
254
-
255
-
256
-
257
-
258
-
259
-
260
-
261
-
262
-
263
-
264
-
265
-
266
-
267
-
268
-
269
-
270
-
271
-
272
-
273
-
274
-
275
-
276
-
277
-
278
-
279
-
280
-
281
-
282
-
283
-
284
-
285
-
286
-
287
-
288
-
289
-
290
-
291
-
292
-
293
-
294
-
295
-
296
-
297
-
298
-
299
-
300
-
301
-
302
-
303
-
304
 |
 |
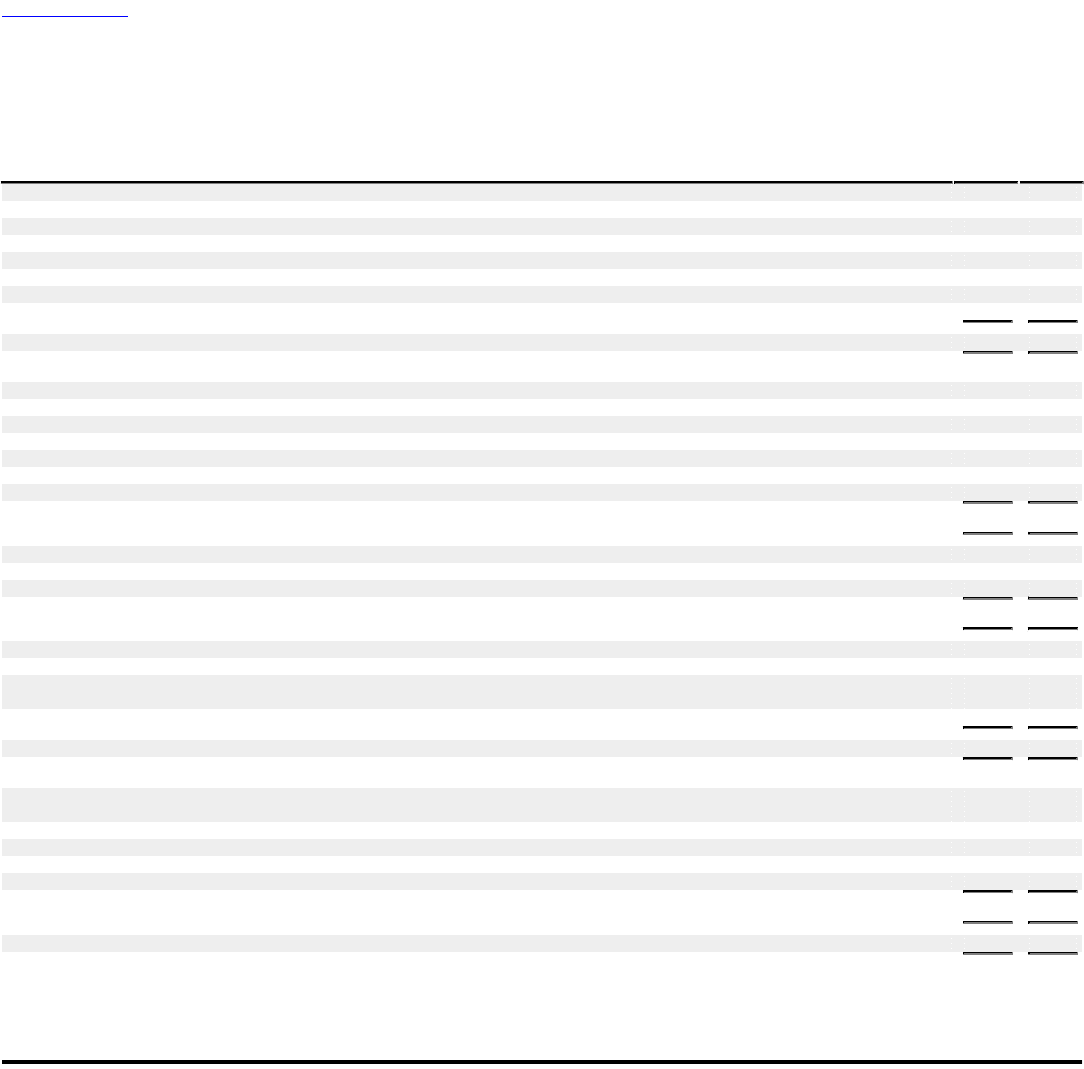
Table of Contents
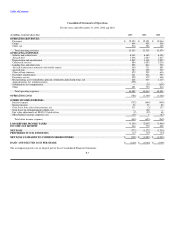
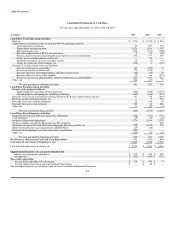
Consolidated Balance Sheets
December 31, 2003 and 2002
LIABILITIES AND SHAREOWNERS' (DEFICIT) EQUITY
(in millions, except share data) 2003 2002
CURRENT LIABILITIES:
Current maturities of long-term debt $ 1,002 $ 666
Current obligations under capital leases 19 27
Accounts payable, deferred credits and other accrued liabilities 1,759 1,921
Air traffic liability 1,308 1,270
Taxes payable 915 862
Accrued salaries and related benefits 1,285 1,365
Accrued rent 336 344
Total current liabilities 6,624 6,455
NONCURRENT LIABILITIES:
Long-term debt 10,962 9,576
Long-term debt issued by Massachusetts Port Authority (Note 6) 498 498
Capital leases 78 100
Postretirement benefits 2,253 2,282
Accrued rent 701 739
Pension and related benefits 4,886 3,242
Other 204 93
Total noncurrent liabilities 19,582 16,530
DEFERRED CREDITS:
Deferred gains on sale and leaseback transactions 426 478
Deferred revenue and other credits 108 100
Total deferred credits 534 578
COMMITMENTS AND CONTINGENCIES (Notes 3, 4, 6, 7, 8 and 9)
EMPLOYEE STOCK OWNERSHIP PLAN PREFERRED STOCK:
Series B ESOP Convertible Preferred Stock, $1.00 par value, $72.00 stated and liquidation value; 5,839,708 shares issued and
outstanding at December 31, 2003, and 6,065,489 shares issued and outstanding at December 31, 2002 420 437
Unearned compensation under employee stock ownership plan (145) (173)
Total Employee Stock Ownership Plan Preferred Stock 275 264
SHAREOWNERS' (DEFICIT) EQUITY:
Common stock, $1.50 par value; $450,000,000 authorized; 180,915,087 shares issued at December 31, 2003, and 180,903,373 shares
issued at December 31, 2002 271 271
Additional paid-in capital 3,272 3,263
Retained earnings 844 1,639
Accumulated other comprehensive loss (2,338) (1,562)
Treasury stock at cost, 57,370,142 shares at December 31, 2003, and 57,544,168 shares at December 31, 2002 (2,708) (2,718)
Total shareowners' (deficit) equity (659) 893
Total liabilities and shareowners' (deficit) equity $26,356 $24,720
The accompanying notes are an integral part of these Consolidated Financial Statements.
F-6