Delta Airlines 2003 Annual Report Download - page 42
Download and view the complete annual report
Please find page 42 of the 2003 Delta Airlines annual report below. You can navigate through the pages in the report by either clicking on the pages listed below, or by using the keyword search tool below to find specific information within the annual report.-
 1
1 -
2
-
3
-
4
-
5
-
6
-
7
-
8
-
9
-
10
-
11
-
12
-
13
-
14
-
15
-
16
-
17
-
18
-
19
-
20
-
21
-
22
-
23
-
24
-
25
-
26
-
27
-
28
-
29
-
30
-
31
-
 32
32 -
 33
33 -
 34
34 -
 35
35 -
 36
36 -
 37
37 -
 38
38 -
 39
39 -
 40
40 -
 41
41 -
 42
42 -
 43
43 -
 44
44 -
 45
45 -
 46
46 -
 47
47 -
 48
48 -
 49
49 -
 50
50 -
 51
51 -
 52
52 -
53
-
54
-
55
-
56
-
57
-
58
-
59
-
60
-
61
-
62
-
63
-
64
-
65
-
66
-
67
-
68
-
69
-
70
-
71
-
72
-
73
-
74
-
75
-
76
-
77
-
78
-
79
-
80
-
81
-
82
-
83
-
84
-
85
-
86
-
87
-
88
-
89
-
90
-
91
-
92
-
93
-
94
-
95
-
96
-
97
-
98
-
99
-
100
-
101
-
102
-
103
-
104
-
105
-
106
-
107
-
108
-
109
-
110
-
111
-
112
-
113
-
114
-
115
-
116
-
117
-
118
-
119
-
120
-
121
-
122
-
123
-
124
-
125
-
126
-
127
-
128
-
129
-
130
-
131
-
132
-
133
-
134
-
135
-
136
-
137
-
138
-
139
-
140
-
141
-
142
-
143
-
144
-
145
-
146
-
147
-
148
-
149
-
150
-
151
-
152
-
153
-
154
-
155
-
156
-
157
-
158
-
159
-
160
-
161
-
162
-
163
-
164
-
165
-
166
-
167
-
168
-
169
-
170
-
171
-
172
-
173
-
174
-
175
-
176
-
177
-
178
-
179
-
180
-
181
-
182
-
183
-
184
-
185
-
186
-
187
-
188
-
189
-
190
-
191
-
192
-
193
-
194
-
195
-
196
-
197
-
198
-
199
-
200
-
201
-
202
-
203
-
204
-
205
-
206
-
207
-
208
-
209
-
210
-
211
-
212
-
213
-
214
-
215
-
216
-
217
-
218
-
219
-
220
-
221
-
222
-
223
-
224
-
225
-
226
-
227
-
228
-
229
-
230
-
231
-
232
-
233
-
234
-
235
-
236
-
237
-
238
-
239
-
240
-
241
-
242
-
243
-
244
-
245
-
246
-
247
-
248
-
249
-
250
-
251
-
252
-
253
-
254
-
255
-
256
-
257
-
258
-
259
-
260
-
261
-
262
-
263
-
264
-
265
-
266
-
267
-
268
-
269
-
270
-
271
-
272
-
273
-
274
-
275
-
276
-
277
-
278
-
279
-
280
-
281
-
282
-
283
-
284
-
285
-
286
-
287
-
288
-
289
-
290
-
291
-
292
-
293
-
294
-
295
-
296
-
297
-
298
-
299
-
300
-
301
-
302
-
303
-
304
 |
 |

Table of Contents
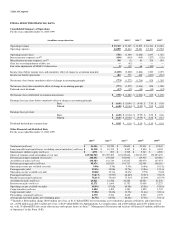
Results of Operations—2003 Compared to 2002
Net Loss per Share. We recorded a consolidated net loss of $773 million ($6.40 diluted loss per share) in 2003, compared to a consolidated net loss of
$1.3 billion ($10.44 diluted loss per share) in 2002.
Operating Revenues. Operating and passenger revenues remained unchanged at $13.3 billion and $12.3 billion, respectively, in 2003 compared to 2002.
Revenue Passenger Miles ("RPM"s) decreased 3% on a capacity decline of 5%, while passenger mile yield increased 3% to 12.49¢. For information about the
factors negatively impacting the revenue environment, see the Business Environment section of Management's Discussion and Analysis in this Form 10-K.
North American Passenger Revenues. North American passenger revenues remained unchanged at $10.0 billion in 2003. RPMs decreased 1% on a
capacity decrease of 3%, while passenger mile yield increased 1%. Load factors increased by 1.6 points.
International Passenger Revenues. International passenger revenues decreased 5% to $2.2 billion in 2003. RPMs fell 12% on a capacity decline of 14%,
while passenger mile yield increased 9%. The decline in international revenue passenger miles, particularly in the Atlantic region, is due to the reduction in
traffic in the period leading up to and during the military action in Iraq. The increase in passenger mile yield primarily relates to the reduction of capacity in
certain markets and favorable foreign currency exchange rates.
Cargo and Other Revenues. Cargo revenues increased 1% to $464 million in 2003. Cargo ton miles decreased 6% due to reductions in capacity, while
cargo ton mile yield increased 8%. Other revenues decreased 2% to $516 million, primarily reflecting decreases due to lower revenue from certain mileage
partnership arrangements as well as a decline in codeshare revenue. These decreases were partially offset by an increase in various miscellaneous revenues
and growth under our contract carrier arrangements.
Operating Expenses. Operating expenses totaled $14.1 billion for 2003, decreasing 4% from 2002. Operating capacity decreased 5% to 134 billion
Available Seat Miles ("ASM"s) primarily due to capacity reductions implemented as a result of the military action in Iraq. Because there has been some
improvement in passenger demand since the end of major military combat in Iraq in May 2003, we have now restored most of this capacity. Operating Cost
per Available Seat Mile ("CASM") rose 2% to 10.48¢. Operating expenses and CASM reflect (1) Appropriations Act reimbursements received during 2003;
(2) restructuring, asset writedowns, pension settlements and related items, net recorded during 2003 and 2002; and (3) Stabilization Act compensation
recorded in 2002. These items are discussed below.
Salaries and related costs totaled $6.3 billion in 2003, a 3% increase from 2002. This 3% increase primarily reflects (1) a 5% increase from higher pension
and related expense of approximately $290 million; (2) a 2% increase due to salary rate increases primarily for pilots in the June 2003 and 2002 quarters
under their collective bargaining agreement, and for mechanics in the June 2002 quarter; and (3) a 2% increase due to growth in our wholly-owned
subsidiaries' regional jet operations. These increases were partially offset by a 6% decrease due
35