Dell 2008 Annual Report Download - page 96
Download and view the complete annual report
Please find page 96 of the 2008 Dell annual report below. You can navigate through the pages in the report by either clicking on the pages listed below, or by using the keyword search tool below to find specific information within the annual report.-
 1
1 -
2
-
3
-
4
-
5
-
6
-
7
-
8
-
9
-
10
-
11
-
12
-
13
-
14
-
15
-
16
-
17
-
18
-
19
-
20
-
21
-
22
-
23
-
24
-
25
-
26
-
27
-
28
-
29
-
30
-
31
-
32
-
33
-
34
-
35
-
36
-
37
-
38
-
39
-
40
-
41
-
42
-
43
-
44
-
45
-
46
-
47
-
48
-
49
-
50
-
51
-
52
-
53
-
54
-
55
-
56
-
57
-
58
-
59
-
60
-
61
-
62
-
63
-
64
-
65
-
66
-
67
-
68
-
69
-
70
-
71
-
72
-
73
-
74
-
75
-
76
-
77
-
78
-
79
-
80
-
81
-
82
-
83
-
84
-
85
-
 86
86 -
 87
87 -
 88
88 -
 89
89 -
 90
90 -
 91
91 -
 92
92 -
 93
93 -
 94
94 -
 95
95 -
 96
96 -
 97
97 -
 98
98 -
 99
99 -
 100
100 -
 101
101 -
 102
102 -
 103
103 -
 104
104 -
 105
105 -
 106
106 -
107
-
108
-
109
-
110
-
111
-
112
-
113
-
114
-
115
-
116
-
117
-
118
-
119
-
120
-
121
-
122
-
123
-
124
-
125
-
126
-
127
-
128
-
129
-
130
-
131
-
132
-
133
-
134
-
135
-
136
-
137
-
138
-
139
-
140
-
141
-
142
-
143
-
144
-
145
-
146
-
147
-
148
-
149
-
150
-
151
-
152
-
153
-
154
-
155
-
156
-
157
-
158
-
159
-
160
-
161
-
162
-
163
-
164
-
165
-
166
-
167
-
168
-
169
-
170
-
171
-
172
-
173
-
174
-
175
-
176
-
177
-
178
-
179
-
180
-
181
-
182
-
183
-
184
-
185
-
186
-
187
-
188
-
189
-
190
-
191
-
192
 |
 |

Table of Contents
DELL INC.
NOTES TO CONSOLIDATED FINANCIAL STATEMENTS (Continued)
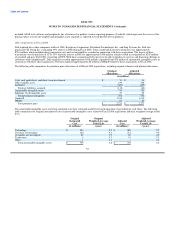
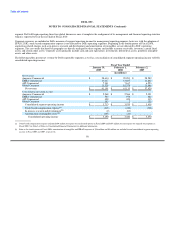
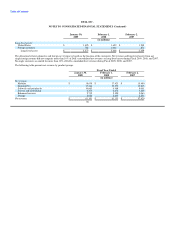
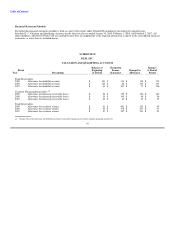
The table below provides a detailed presentation of investment and other income, net for Fiscal 2009, Fiscal 2008, and Fiscal 2007:
Fiscal Year Ended
January 30, February 1, February 2,
2009 2008 2007
(in millions)
Investment and other income, net:
Investment income, primarily interest $ 180 $ 496 $ 368
(Losses) gains on investments, net (10) 14 (5)
Interest expense (93) (45) (45)
CIT minority interest - (29) (23)
Foreign exchange 115 (30) (37)
Gain on sale of building - - 36
Other (58) (19) (19)
Investment and other income, net $ 134 $ 387 $ 275
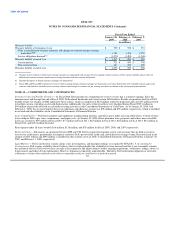
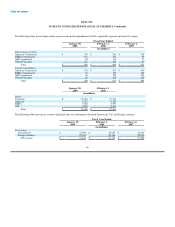
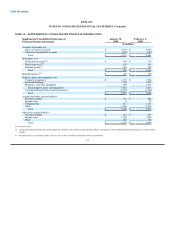
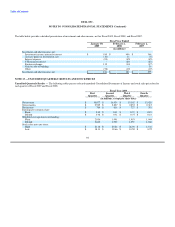
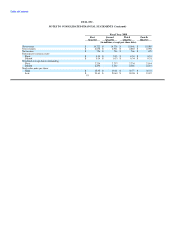
NOTE 13 —UNAUDITED QUARTERLY RESULTS AND STOCK PRICES
Unaudited Quarterly Results — The following tables present selected unaudited Consolidated Statements of Income and stock sales price data for
each quarter of Fiscal 2009 and Fiscal 2008:
Fiscal Year 2009
First Second Third Fourth
Quarter Quarter Quarter Quarter
(in millions, except per share data)
Net revenue $ 16,077 $ 16,434 $ 15,162 $ 13,428
Gross margin $ 2,965 $ 2,827 $ 2,853 $ 2,312
Net income $ 784 $ 616 $ 727 $ 351
Earnings per common share:
Basic $ 0.39 $ 0.31 $ 0.37 $ 0.18
Diluted $ 0.38 $ 0.31 $ 0.37 $ 0.18
Weighted-average shares outstanding:
Basic 2,036 1,991 1,953 1,944
Diluted 2,040 1,999 1,957 1,948
Stock sales price per share:
High $ 21.18 $ 25.26 $ 26.04 $ 13.32
Low $ 18.13 $ 18.66 $ 10.59 $ 8.72
92