Dell 2008 Annual Report Download - page 27
Download and view the complete annual report
Please find page 27 of the 2008 Dell annual report below. You can navigate through the pages in the report by either clicking on the pages listed below, or by using the keyword search tool below to find specific information within the annual report.-
 1
1 -
2
-
3
-
4
-
5
-
6
-
7
-
8
-
9
-
10
-
11
-
12
-
13
-
14
-
15
-
16
-
 17
17 -
 18
18 -
 19
19 -
 20
20 -
 21
21 -
 22
22 -
 23
23 -
 24
24 -
 25
25 -
 26
26 -
 27
27 -
 28
28 -
 29
29 -
 30
30 -
 31
31 -
 32
32 -
 33
33 -
 34
34 -
 35
35 -
 36
36 -
 37
37 -
38
-
39
-
40
-
41
-
42
-
43
-
44
-
45
-
46
-
47
-
48
-
49
-
50
-
51
-
52
-
53
-
54
-
55
-
56
-
57
-
58
-
59
-
60
-
61
-
62
-
63
-
64
-
65
-
66
-
67
-
68
-
69
-
70
-
71
-
72
-
73
-
74
-
75
-
76
-
77
-
78
-
79
-
80
-
81
-
82
-
83
-
84
-
85
-
86
-
87
-
88
-
89
-
90
-
91
-
92
-
93
-
94
-
95
-
96
-
97
-
98
-
99
-
100
-
101
-
102
-
103
-
104
-
105
-
106
-
107
-
108
-
109
-
110
-
111
-
112
-
113
-
114
-
115
-
116
-
117
-
118
-
119
-
120
-
121
-
122
-
123
-
124
-
125
-
126
-
127
-
128
-
129
-
130
-
131
-
132
-
133
-
134
-
135
-
136
-
137
-
138
-
139
-
140
-
141
-
142
-
143
-
144
-
145
-
146
-
147
-
148
-
149
-
150
-
151
-
152
-
153
-
154
-
155
-
156
-
157
-
158
-
159
-
160
-
161
-
162
-
163
-
164
-
165
-
166
-
167
-
168
-
169
-
170
-
171
-
172
-
173
-
174
-
175
-
176
-
177
-
178
-
179
-
180
-
181
-
182
-
183
-
184
-
185
-
186
-
187
-
188
-
189
-
190
-
191
-
192
 |
 |

Table of Contents
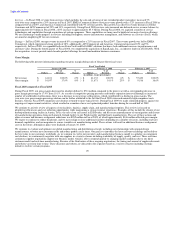
slower unit growth in the second half of Fiscal 2009 reflects our decision in an eroding demand environment to selectively pursue unit growth
opportunities while protecting profitability. We will continue to focus on improving the mix of our product portfolio to higher margin products and
recurring revenue streams.
Fiscal 2009 compared to Fiscal 2008
Fiscal 2009 was a year of mixed results for us. During the first half of the fiscal year we capitalized on growth opportunities and experienced double
digit growth driven by increased industry demand. This growth was followed by a period of challenging economic conditions, with a decline in
global IT end-user demand. As a result, during the second half of Fiscal 2009, we realigned our balance of liquidity, profitability, and growth,
selectively focusing on areas that provided profitable growth opportunities. Throughout the year we took actions to reduce operating expenses and
optimize product costs. While no one can predict the severity and duration of the current global economic slowdown, we are planning for a
continued challenging end-user demand environment in Fiscal 2010. We will selectively invest in strategic growth opportunities, and we will
continue our activity around optimizing and transforming our cost structure.
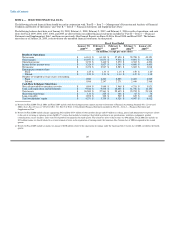
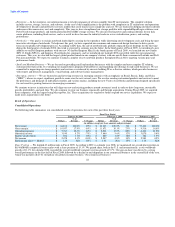
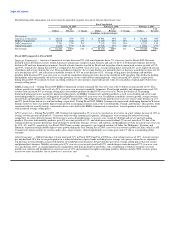
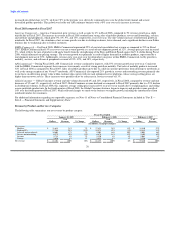
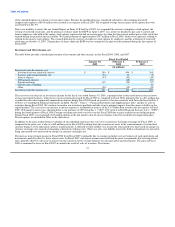
Net Revenue — Fiscal 2009 revenue remained flat year-over-year at $61.1 billion even though unit shipments increased 7% year-over-year. Our
revenue performance is primarily attributed to a decrease in selling prices, as discussed further below. During Fiscal 2009, our global commercial
business revenue declined 2% year-over-year while unit shipment remained flat as a result of the challenging economic environment that was
prevalent in the second half of Fiscal 2009. Our global consumer business offset this decline in revenue by posting year-over-year revenue growth of
11% on unit growth of 35% for Fiscal 2009.
Our average selling price (total revenue per unit sold) during Fiscal 2009 decreased 7% year-over-year. Average selling prices were impacted by a
change in revenue mix between our commercial and consumer business. Selling prices in our commercial business are typically higher than our
consumer business selling prices. During the year our global consumer unit shipments grew significantly whereas our commercial unit shipments
remained flat year over year. Our increased presence in consumer retail also contributed to our average selling price decline as retail typically has
lower average selling prices than our on-line and phone direct business. Average selling prices were also impacted by a competitive pricing
environment. Our market strategy has been to concentrate on solution sales to drive a more profitable mix of products and services, while pricing our
products to remain competitive in the marketplace. During Fiscal 2009, we continued to see competitive pressure, particularly for lower priced
desktops and notebooks, as we targeted a broader range of products and price bands. We expect this competitive pricing environment will continue
for the foreseeable future.
Revenue outside the U.S. represented approximately 48% of Fiscal 2009 net revenue. Outside the U.S., we produced 4% year-over-year revenue
growth for Fiscal 2009 as opposed to a 3% decline in revenue for the U.S. The decline in our U.S. revenue is mainly attributable to our commercial
business in the U.S., which was impacted by the downturn in the global economy during the second half of Fiscal 2009. Our U.S. consumer business
was also impacted by the economic slowdown; however, its revenue increased 5% year-over-year, aided by our expansion into retail through an
increased number of worldwide retail locations. Outside of the U.S. we continue to focus on revenue and unit growth in the BRIC countries. BRIC
revenue growth during Fiscal 2009 was 20% as we are tailoring solutions to meet specific regional needs, enhancing relationships to provide
customer choice and flexibility, and expanding into these and other emerging countries that represent the vast majority of the world's population.
From a worldwide product perspective, the continuing decline in desktop unit sales and prices, and decreases in mobility selling prices contributed
heavily to our Fiscal 2009 performance.
During Fiscal 2009, the U.S. dollar experienced significant volatility relative to the other principal currencies in which we transact business with the
exception of the Japanese Yen. We manage our business on a U.S. Dollar basis, and as a result of our comprehensive hedging program, foreign
currency fluctuations did not have a significant impact on our consolidated results of operations.
Operating Income — Operating income decreased 7% year-over-year to $3.2 billion in Fiscal 2009. The decrease was partially driven by a shift in
product mix that resulted in lower average selling prices. Additionally, operating income was impacted by higher cost of sales, which lowered our
gross margin percentage, partially offset by reduced operating expenses.
Net Income — For Fiscal 2009 net income decreased 16% year-over-year to $2.5 billion. Net income was impacted by a 7% year-over-year decline
in operating income, a 65% decline in investment and other income, and an increase in our effective tax rate from 23.0% to 25.4%.
23