Dell 2008 Annual Report Download - page 56
Download and view the complete annual report
Please find page 56 of the 2008 Dell annual report below. You can navigate through the pages in the report by either clicking on the pages listed below, or by using the keyword search tool below to find specific information within the annual report.-
 1
1 -
2
-
3
-
4
-
5
-
6
-
7
-
8
-
9
-
10
-
11
-
12
-
13
-
14
-
15
-
16
-
17
-
18
-
19
-
20
-
21
-
22
-
23
-
24
-
25
-
26
-
27
-
28
-
29
-
30
-
31
-
32
-
33
-
34
-
35
-
36
-
37
-
38
-
39
-
40
-
41
-
42
-
43
-
44
-
45
-
 46
46 -
 47
47 -
 48
48 -
 49
49 -
 50
50 -
 51
51 -
 52
52 -
 53
53 -
 54
54 -
 55
55 -
 56
56 -
 57
57 -
 58
58 -
 59
59 -
 60
60 -
 61
61 -
 62
62 -
 63
63 -
 64
64 -
 65
65 -
 66
66 -
67
-
68
-
69
-
70
-
71
-
72
-
73
-
74
-
75
-
76
-
77
-
78
-
79
-
80
-
81
-
82
-
83
-
84
-
85
-
86
-
87
-
88
-
89
-
90
-
91
-
92
-
93
-
94
-
95
-
96
-
97
-
98
-
99
-
100
-
101
-
102
-
103
-
104
-
105
-
106
-
107
-
108
-
109
-
110
-
111
-
112
-
113
-
114
-
115
-
116
-
117
-
118
-
119
-
120
-
121
-
122
-
123
-
124
-
125
-
126
-
127
-
128
-
129
-
130
-
131
-
132
-
133
-
134
-
135
-
136
-
137
-
138
-
139
-
140
-
141
-
142
-
143
-
144
-
145
-
146
-
147
-
148
-
149
-
150
-
151
-
152
-
153
-
154
-
155
-
156
-
157
-
158
-
159
-
160
-
161
-
162
-
163
-
164
-
165
-
166
-
167
-
168
-
169
-
170
-
171
-
172
-
173
-
174
-
175
-
176
-
177
-
178
-
179
-
180
-
181
-
182
-
183
-
184
-
185
-
186
-
187
-
188
-
189
-
190
-
191
-
192
 |
 |
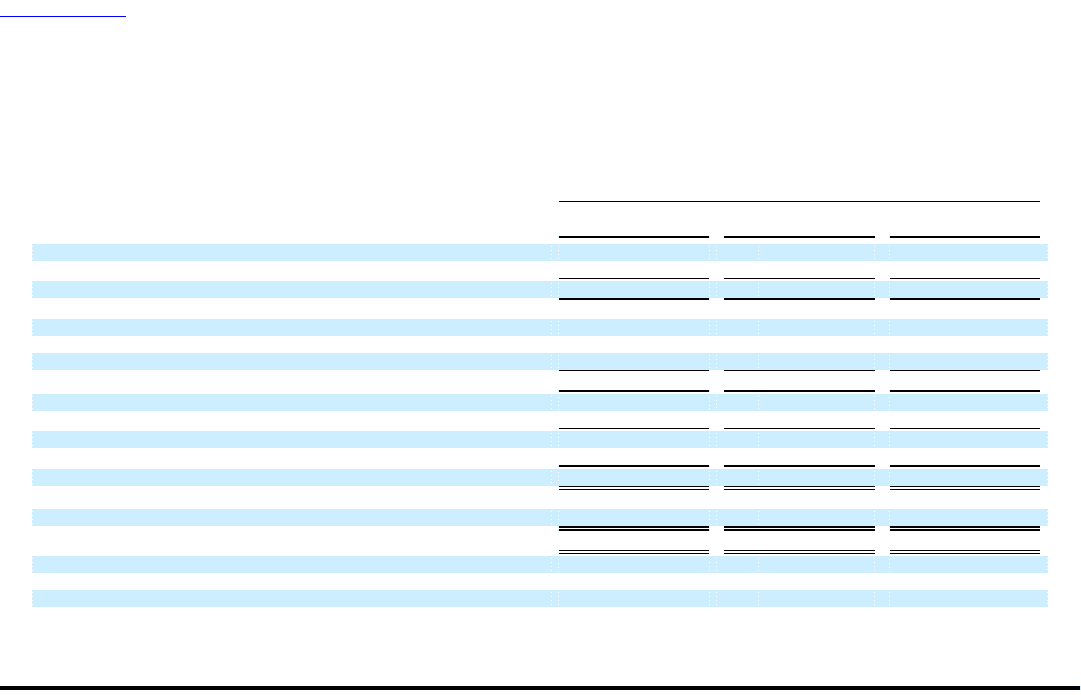
Table of Contents
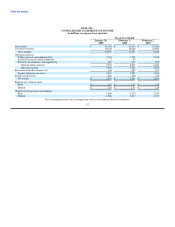
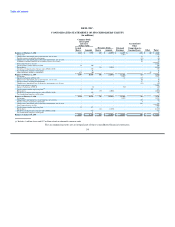
DELL INC.
CONSOLIDATED STATEMENTS OF INCOME
(in millions, except per share amounts)
Fiscal Year Ended
January 30, February 1, February 2,
2009 2008 2007
Net revenue $ 61,101 $ 61,133 $ 57,420
Cost of net revenue 50,144 49,462 47,904
Gross margin 10,957 11,671 9,516
Operating expenses:
Selling, general, and administrative 7,102 7,538 5,948
In-process research and development 2 83 -
Research, development, and engineering 663 610 498
Total operating expenses 7,767 8,231 6,446
Operating income 3,190 3,440 3,070
Investment and other income, net 134 387 275
Income before income taxes 3,324 3,827 3,345
Income tax provision 846 880 762
Net income $ 2,478 $ 2,947 $ 2,583
Earnings per common share:
Basic $ 1.25 $ 1.33 $ 1.15
Diluted $ 1.25 $ 1.31 $ 1.14
Weighted-average shares outstanding:
Basic 1,980 2,223 2,255
Diluted 1,986 2,247 2,271
The accompanying notes are an integral part of these consolidated financial statements.
52