Dell 2008 Annual Report Download - page 84
Download and view the complete annual report
Please find page 84 of the 2008 Dell annual report below. You can navigate through the pages in the report by either clicking on the pages listed below, or by using the keyword search tool below to find specific information within the annual report.-
 1
1 -
2
-
3
-
4
-
5
-
6
-
7
-
8
-
9
-
10
-
11
-
12
-
13
-
14
-
15
-
16
-
17
-
18
-
19
-
20
-
21
-
22
-
23
-
24
-
25
-
26
-
27
-
28
-
29
-
30
-
31
-
32
-
33
-
34
-
35
-
36
-
37
-
38
-
39
-
40
-
41
-
42
-
43
-
44
-
45
-
46
-
47
-
48
-
49
-
50
-
51
-
52
-
53
-
54
-
55
-
56
-
57
-
58
-
59
-
60
-
61
-
62
-
63
-
64
-
65
-
66
-
67
-
68
-
69
-
70
-
71
-
72
-
73
-
 74
74 -
 75
75 -
 76
76 -
 77
77 -
 78
78 -
 79
79 -
 80
80 -
 81
81 -
 82
82 -
 83
83 -
 84
84 -
 85
85 -
 86
86 -
 87
87 -
 88
88 -
 89
89 -
 90
90 -
 91
91 -
 92
92 -
 93
93 -
 94
94 -
95
-
96
-
97
-
98
-
99
-
100
-
101
-
102
-
103
-
104
-
105
-
106
-
107
-
108
-
109
-
110
-
111
-
112
-
113
-
114
-
115
-
116
-
117
-
118
-
119
-
120
-
121
-
122
-
123
-
124
-
125
-
126
-
127
-
128
-
129
-
130
-
131
-
132
-
133
-
134
-
135
-
136
-
137
-
138
-
139
-
140
-
141
-
142
-
143
-
144
-
145
-
146
-
147
-
148
-
149
-
150
-
151
-
152
-
153
-
154
-
155
-
156
-
157
-
158
-
159
-
160
-
161
-
162
-
163
-
164
-
165
-
166
-
167
-
168
-
169
-
170
-
171
-
172
-
173
-
174
-
175
-
176
-
177
-
178
-
179
-
180
-
181
-
182
-
183
-
184
-
185
-
186
-
187
-
188
-
189
-
190
-
191
-
192
 |
 |

Table of Contents
DELL INC.
NOTES TO CONSOLIDATED FINANCIAL STATEMENTS (Continued)
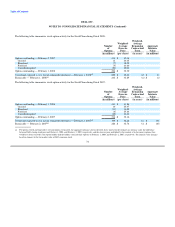
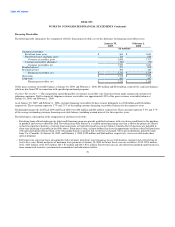
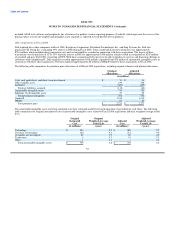
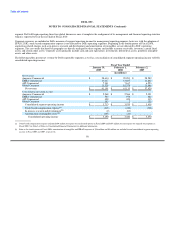
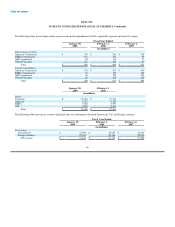
The impact of adverse changes to the key valuation assumptions to the fair value of retained interest at January 30, 2009 is shown in the following
table (in millions):
Expected prepayment speed: 10% $ (9)
Expected prepayment speed: 20% $ (17)
Expected credit losses: 10% $ (13)
Expected credit losses: 20% $ (21)
Discount rate: 10% $ (5)
Discount rate: 20% $ (10)
The analyses above utilized 10% and 20% adverse variation in assumptions to assess the sensitivities in fair value of the retained interest. However,
these changes generally cannot be extrapolated because the relationship between a change in one assumption to the resulting change in fair value
may not be linear. For the above sensitivity analyses, each key assumption was isolated and evaluated separately. Each assumption was adjusted by
10% and 20% while holding the other key assumptions constant. Assumptions may be interrelated, and changes to one assumption may impact
others and the resulting fair value of the retained interest. For example, increases in market interest rates may result in lower prepayments and
increased credit losses. The effect of multiple assumption changes were not considered in the analyses.
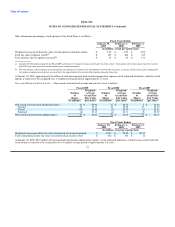
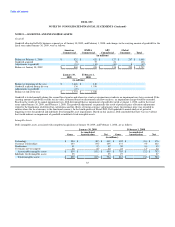
Asset Securitization
During Fiscal 2009 and Fiscal 2008, Dell transferred $1.4 billion and $1.2 billion respectively, of fixed-term leases and loans and revolving loans to
unconsolidated qualifying special purpose entities. The qualifying special purpose entities are bankruptcy remote legal entities with assets and
liabilities separate from those of Dell. The purpose of the qualifying special purpose entities is to facilitate the funding of financing receivables in the
capital markets. The qualifying special purpose entities have entered into financing arrangements with three multi-seller conduits that, in turn, issue
asset-backed debt securities in the capital markets. Two of the three conduits fund fixed-term leases and loans, and one conduit funds revolving
loans. The principal balance of the securitized receivables at the end of Fiscal 2009 and Fiscal 2008 was $1.4 billion and $1.2 billion, respectively.
Dell services securitized contracts and earns a servicing fee. Dell's securitization transactions generally do not result in servicing assets and liabilities
as the contractual fees are adequate compensation in relation to the associated servicing cost.
During Fiscal 2009, the disruption in the debt and capital markets resulted in reduced liquidity and increased costs for funding of financial assets.
Due to a proposed increase to the cost structure in Dell's revolving securitization arrangement, Dell elected not to extend the terms of the agreement.
This resulted in a scheduled amortization of the transaction. During this scheduled amortization period, all principal collections will be used to pay
down the outstanding debt amount related to the securitized assets. The right to receive cash collections is delayed until the debt is fully paid.
During the scheduled amortization, no transfers of new revolving loans will occur. Additional purchases made on existing securitized revolving
loans (repeat purchases) will continue to be transferred to the qualified special purpose entity and will increase the retained interest in securitized
assets on the balance sheet.
Dell's securitization programs contain standard structural features related to the performance of the securitized receivables. These structural features
include defined credit losses, delinquencies, average credit scores, and excess collections above or below specified levels. In the event one or more
of these features are met and Dell is unable to restructure the program, no further funding of receivables will be permitted and the timing of expected
retained interest cash flows will be delayed, which would impact the valuation of the retained interest. For the revolving transaction currently under
scheduled amortization, performance features have been suspended.
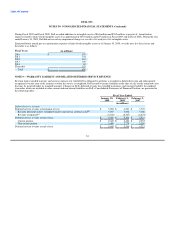
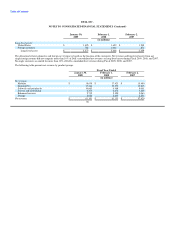
As of January 30, 2009, and February 1, 2008, securitized financing receivables 60 days or more delinquent were $63 million and $54 million,
respectively. These amounts represent 4.6% and 4.4% of the ending securitized financing receivables balances for the respective years.
Net principal charge-offs for Fiscal 2009 and Fiscal 2008, were $114 million and $81 million, respectively. These amounts represent 8.2% and 7.0%
of the average outstanding securitized financing receivable balance for the respective years.
80