Dell 2008 Annual Report Download - page 94
Download and view the complete annual report
Please find page 94 of the 2008 Dell annual report below. You can navigate through the pages in the report by either clicking on the pages listed below, or by using the keyword search tool below to find specific information within the annual report.-
 1
1 -
2
-
3
-
4
-
5
-
6
-
7
-
8
-
9
-
10
-
11
-
12
-
13
-
14
-
15
-
16
-
17
-
18
-
19
-
20
-
21
-
22
-
23
-
24
-
25
-
26
-
27
-
28
-
29
-
30
-
31
-
32
-
33
-
34
-
35
-
36
-
37
-
38
-
39
-
40
-
41
-
42
-
43
-
44
-
45
-
46
-
47
-
48
-
49
-
50
-
51
-
52
-
53
-
54
-
55
-
56
-
57
-
58
-
59
-
60
-
61
-
62
-
63
-
64
-
65
-
66
-
67
-
68
-
69
-
70
-
71
-
72
-
73
-
74
-
75
-
76
-
77
-
78
-
79
-
80
-
81
-
82
-
83
-
 84
84 -
 85
85 -
 86
86 -
 87
87 -
 88
88 -
 89
89 -
 90
90 -
 91
91 -
 92
92 -
 93
93 -
 94
94 -
 95
95 -
 96
96 -
 97
97 -
 98
98 -
 99
99 -
 100
100 -
 101
101 -
 102
102 -
 103
103 -
 104
104 -
105
-
106
-
107
-
108
-
109
-
110
-
111
-
112
-
113
-
114
-
115
-
116
-
117
-
118
-
119
-
120
-
121
-
122
-
123
-
124
-
125
-
126
-
127
-
128
-
129
-
130
-
131
-
132
-
133
-
134
-
135
-
136
-
137
-
138
-
139
-
140
-
141
-
142
-
143
-
144
-
145
-
146
-
147
-
148
-
149
-
150
-
151
-
152
-
153
-
154
-
155
-
156
-
157
-
158
-
159
-
160
-
161
-
162
-
163
-
164
-
165
-
166
-
167
-
168
-
169
-
170
-
171
-
172
-
173
-
174
-
175
-
176
-
177
-
178
-
179
-
180
-
181
-
182
-
183
-
184
-
185
-
186
-
187
-
188
-
189
-
190
-
191
-
192
 |
 |
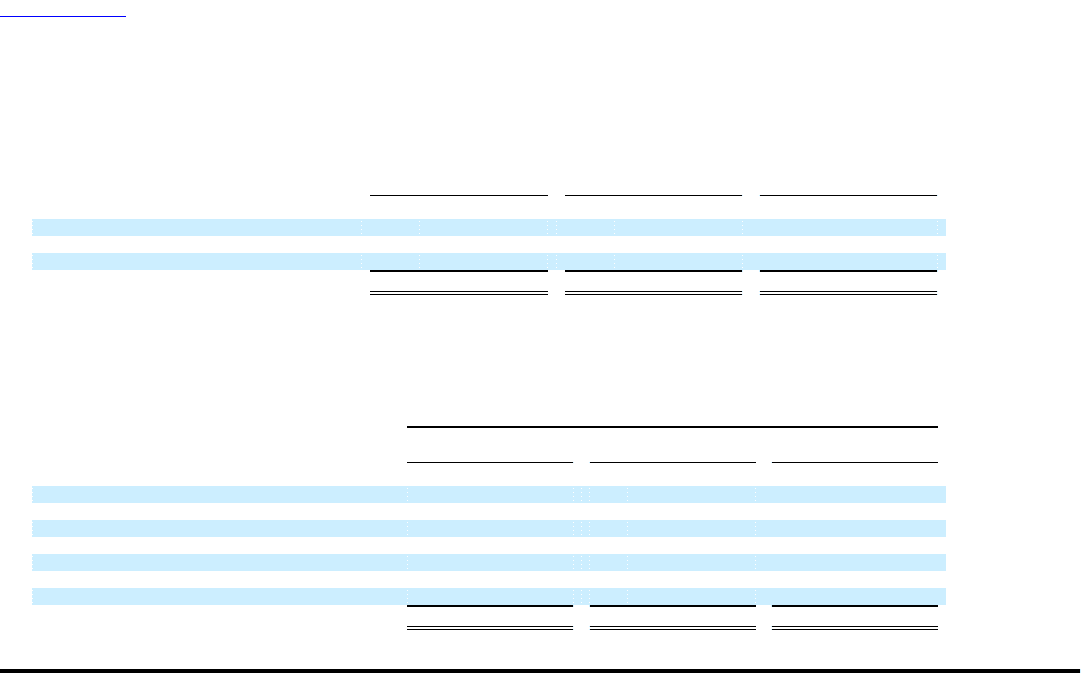
Table of Contents
DELL INC.
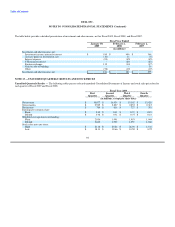
NOTES TO CONSOLIDATED FINANCIAL STATEMENTS (Continued)
January 30, February 1, February 2,
2009 2008 2007
(in millions)
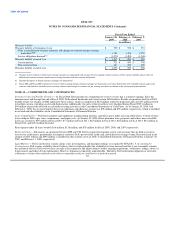
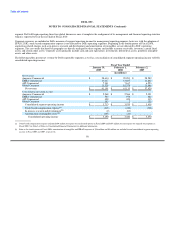
Long-lived assets:
United States $ 1,495 $ 1,622 $ 1,538
Foreign countries 782 1,046 871
Long-lived assets $ 2,277 $ 2,668 $ 2,409
The allocation between domestic and foreign net revenue is based on the location of the customers. Net revenue and long-lived assets from any
single foreign country did not comprise more than 10% of Dell's consolidated net revenues or long-lived assets during Fiscal 2009, 2008, and 2007.
No single customer accounted for more than 10% of Dell's consolidated net revenue during Fiscal 2009, 2008, and 2007.
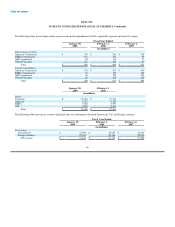
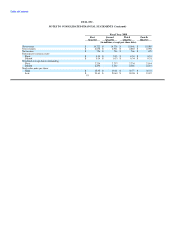
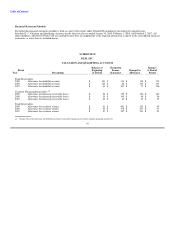
The following table presents net revenue by product groups:
Fiscal Year Ended
January 30, February 1, February 2,
2009 2008 2007
(in millions)
Net revenue:
Mobility $ 18,638 $ 17,423 $ 15,480
Desktop PCs 17,244 19,573 19,815
Software and peripherals 10,603 9,908 9,001
Servers and networking 6,275 6,474 5,805
Enhanced services 5,715 5,320 5,063
Storage 2,626 2,435 2,256
Net revenue $ 61,101 $ 61,133 $ 57,420
90