Dell 2008 Annual Report Download - page 41
Download and view the complete annual report
Please find page 41 of the 2008 Dell annual report below. You can navigate through the pages in the report by either clicking on the pages listed below, or by using the keyword search tool below to find specific information within the annual report.-
 1
1 -
2
-
3
-
4
-
5
-
6
-
7
-
8
-
9
-
10
-
11
-
12
-
13
-
14
-
15
-
16
-
17
-
18
-
19
-
20
-
21
-
22
-
23
-
24
-
25
-
26
-
27
-
28
-
29
-
30
-
 31
31 -
 32
32 -
 33
33 -
 34
34 -
 35
35 -
 36
36 -
 37
37 -
 38
38 -
 39
39 -
 40
40 -
 41
41 -
 42
42 -
 43
43 -
 44
44 -
 45
45 -
 46
46 -
 47
47 -
 48
48 -
 49
49 -
 50
50 -
 51
51 -
52
-
53
-
54
-
55
-
56
-
57
-
58
-
59
-
60
-
61
-
62
-
63
-
64
-
65
-
66
-
67
-
68
-
69
-
70
-
71
-
72
-
73
-
74
-
75
-
76
-
77
-
78
-
79
-
80
-
81
-
82
-
83
-
84
-
85
-
86
-
87
-
88
-
89
-
90
-
91
-
92
-
93
-
94
-
95
-
96
-
97
-
98
-
99
-
100
-
101
-
102
-
103
-
104
-
105
-
106
-
107
-
108
-
109
-
110
-
111
-
112
-
113
-
114
-
115
-
116
-
117
-
118
-
119
-
120
-
121
-
122
-
123
-
124
-
125
-
126
-
127
-
128
-
129
-
130
-
131
-
132
-
133
-
134
-
135
-
136
-
137
-
138
-
139
-
140
-
141
-
142
-
143
-
144
-
145
-
146
-
147
-
148
-
149
-
150
-
151
-
152
-
153
-
154
-
155
-
156
-
157
-
158
-
159
-
160
-
161
-
162
-
163
-
164
-
165
-
166
-
167
-
168
-
169
-
170
-
171
-
172
-
173
-
174
-
175
-
176
-
177
-
178
-
179
-
180
-
181
-
182
-
183
-
184
-
185
-
186
-
187
-
188
-
189
-
190
-
191
-
192
 |
 |

Table of Contents
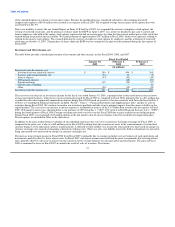
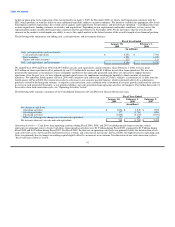
Cash and Investments
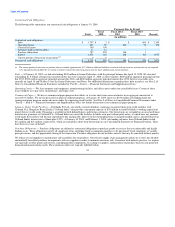
At January 30, 2009, we had $9.5 billion of total cash, cash equivalents, and investments. The objective of our investment policy and strategy is to
manage our total cash and investments balances to preserve principal and maintain liquidity while maximizing the return on the investment portfolio
through the full investment of available funds. We diversify our investment portfolio by investing in multiple types of investment-grade securities
and through the use of third-party investment managers.
Of the $9.5 billion, $8.4 billion is classified as cash and cash equivalents. Our cash equivalents primarily consist of money market funds. Due to the
nature of these investments, we consider it reasonable to expect that they will not be significantly impacted by a change in interest rates, and that
these investments can be liquidated for cash at short notice. As of January 30, 2009, our cash equivalents are at carrying value.
The remaining $1.1 billion is primarily invested in fixed income securities including government, agency, asset-backed, mortgage-backed and
corporate debt securities of varying maturities at the date of acquisition. The fair value of our portfolio is affected primarily by interest rates more so
than by the credit and liquidity issues currently facing the capital markets. We attempt to mitigate these risks by investing primarily in high credit
quality securities with AAA and AA ratings and short-term securities with an A-1 rating, limiting the amount that can be invested in any single
issuer, and by investing in short to intermediate term investments whose market value is less sensitive to interest rate changes. As of January 30,
2009, and February 1, 2008, we did not hold any auction rate securities. Our exposure to asset and mortgage backed securities is less than 1% of the
value of the portfolio. The total carrying value of investments in asset-backed and mortgage-backed debt securities was approximately $54 million
and $550 million at January 30, 2009, and February 1, 2008, respectively. Based on our investment portfolio and interest rates at January 30, 2009, a
100 basis point increase or decrease in interest rates would result in a decrease or increase of approximately $5 million in the fair value of the
investment portfolio.
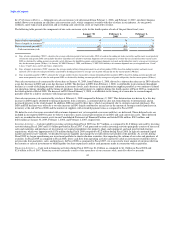
We periodically review our investment portfolio to determine if any investment is other-than-temporarily impaired due to changes in credit risk or
other potential valuation concerns. At January 30, 2009, our portfolio included securities with unrealized losses totaling $10 million, which have
been recorded in other comprehensive income (loss), as we believe the investments are not other-than-temporarily impaired. While these
available-for-sale securities have market values below cost, we believe it is probable that the principal and interest will be collected in accordance
with the contractual terms, and that the decline in the market value is primarily due to changes in interest rates and not increased credit risk.
During Fiscal 2009, we recorded an $11 million other-than-temporary impairment loss based on a review of factors consistent with those disclosed
in Note 2 of Notes to Consolidated Financial Statements included in "Part II — Item 8 — Financial Statements and Supplementary Data." Factors
considered in determining whether a loss is other-than-temporary include the length of time and extent to which fair value has been less than the cost
basis, the financial condition and near-term prospects of the investee, previously recorded other-than-temporary impairment charges, and our intent
and ability to hold the investment for a period of time sufficient to allow for any anticipated recovery in market value. The investments
other-than-temporarily impaired during Fiscal 2009 were asset-backed securities and were impaired due to severe price degradation or price
degradation over an extended period of time, rise in delinquency rates and general credit enhancement declines.
The fair value of our portfolio is based on prices provided from national pricing services, which we currently believe are indicative of fair value as
our assessment is that the inputs are market observable. We will continue to evaluate whether the inputs are market observable in accordance with
SFAS No. 157, Fair Value Measurements ("SFAS 157"). We conduct reviews on a quarterly basis to verify pricing, assess liquidity, and determine
if significant inputs have changed that would impact our SFAS 157 disclosures.
37