Dell 2008 Annual Report Download - page 31
Download and view the complete annual report
Please find page 31 of the 2008 Dell annual report below. You can navigate through the pages in the report by either clicking on the pages listed below, or by using the keyword search tool below to find specific information within the annual report.-
 1
1 -
2
-
3
-
4
-
5
-
6
-
7
-
8
-
9
-
10
-
11
-
12
-
13
-
14
-
15
-
16
-
17
-
18
-
19
-
20
-
 21
21 -
 22
22 -
 23
23 -
 24
24 -
 25
25 -
 26
26 -
 27
27 -
 28
28 -
 29
29 -
 30
30 -
 31
31 -
 32
32 -
 33
33 -
 34
34 -
 35
35 -
 36
36 -
 37
37 -
 38
38 -
 39
39 -
 40
40 -
 41
41 -
42
-
43
-
44
-
45
-
46
-
47
-
48
-
49
-
50
-
51
-
52
-
53
-
54
-
55
-
56
-
57
-
58
-
59
-
60
-
61
-
62
-
63
-
64
-
65
-
66
-
67
-
68
-
69
-
70
-
71
-
72
-
73
-
74
-
75
-
76
-
77
-
78
-
79
-
80
-
81
-
82
-
83
-
84
-
85
-
86
-
87
-
88
-
89
-
90
-
91
-
92
-
93
-
94
-
95
-
96
-
97
-
98
-
99
-
100
-
101
-
102
-
103
-
104
-
105
-
106
-
107
-
108
-
109
-
110
-
111
-
112
-
113
-
114
-
115
-
116
-
117
-
118
-
119
-
120
-
121
-
122
-
123
-
124
-
125
-
126
-
127
-
128
-
129
-
130
-
131
-
132
-
133
-
134
-
135
-
136
-
137
-
138
-
139
-
140
-
141
-
142
-
143
-
144
-
145
-
146
-
147
-
148
-
149
-
150
-
151
-
152
-
153
-
154
-
155
-
156
-
157
-
158
-
159
-
160
-
161
-
162
-
163
-
164
-
165
-
166
-
167
-
168
-
169
-
170
-
171
-
172
-
173
-
174
-
175
-
176
-
177
-
178
-
179
-
180
-
181
-
182
-
183
-
184
-
185
-
186
-
187
-
188
-
189
-
190
-
191
-
192
 |
 |

Table of Contents
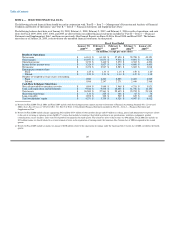
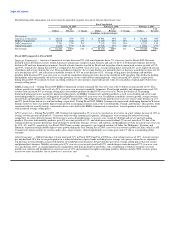
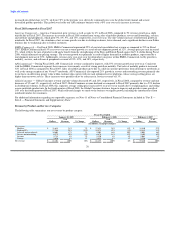
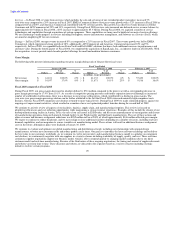
Fiscal 2009 compared to Fiscal 2008
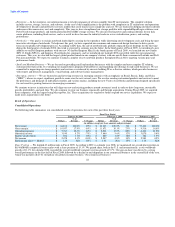
Mobility — During Fiscal 2009 revenue from mobility products (which includes notebook computers and mobile workstations) grew 7% on unit
growth of 24%. According to IDC, our unit growth rate for calendar 2008 was 31%, which was consistent with the industry's growth rate of 32%.
The average selling prices of our mobility products across all of our segments dropped 14% year-over-year due to a soft demand environment and
the continued expansion into retail by our Global Consumer segment due to an increased number of worldwide retail locations. Expansion into retail
also contributed to our overall revenue growth as mobility revenue in Global Consumer increased 32% year-over-year on unit growth of 67%, as
opposed to a decline in mobility revenue of 2% on unit growth of 7% in our global commercial business. APJ Commercial and EMEA Commercial
both grew revenue by 8% on unit growth of 21%. However, Americas Commercial mobility revenue declined 10% year-over-year for Fiscal 2009
on a unit decline of 5% as we experienced conservative customer spending across all business sectors within Americas Commercial, including Latin
America. The slow revenue growth in our commercial business can also be partially attributed to our transition to the new LatitudeTM E-Series and
Dell Precision notebook product lines during the second half of Fiscal 2009. Our new product lines range from the lightest ultra-portable in our
history to the most powerful mobile workstation. We believe the on-going trend to mobility products will continue, and we are therefore focused on
expanding our product platforms to cover broader price bands and functionalities.
In Fiscal 2009, we have launched industry leading mobility products such as the Inspiron 1525, Vostro, and 3G enabled Inspiron Mini. We also
launched our ruggedized LatitudeTM XFR, which is designed for reliable performance in the harshest environments, and introduced our completely
new line of LatitudeTM and Dell Precision notebooks. We introduced the VostroTM A-Series and the Dell 500 during Fiscal 2009, which were
specifically designed for emerging countries. All of our commercial products in emerging countries are now cost optimized. We will continue our
cost optimization efforts in remaining products in Fiscal 2010.
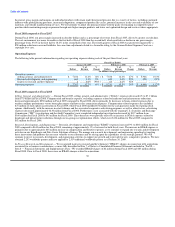
Desktop PCs — During Fiscal 2009 revenue from desktop PCs (which includes desktop computer systems and workstations) decreased
year-over-year 12% on a unit decline of 4%. The decline was primarily due to the on-going competitive pricing pressure for lower priced desktops
and a softening in global IT end-user demand. Consequently, our average selling price for desktops decreased 8% year-over-year during Fiscal 2009
as we aligned our prices and product offerings with the marketplace. For Fiscal 2009, desktop revenue decreased across all segments. Our Global
Consumer, Americas Commercial, EMEA Commercial, and APJ Commercial segments experienced year-over-year revenue declines of 17%, 14%,
11% and 2% respectively. We are continuing to see rising end-user demand for mobility products, which contributes to further slowing demand for
desktop PCs as mobility growth is expected to continue to outpace desktop growth. During Fiscal 2009, we introduced four new models of our
OptiPlexTM commercial desktop systems. These systems cut power consumption by up to 43%, speed serviceability time by more than 40% versus
our competition, and include a portfolio of services that can be accessed by the user as needed.
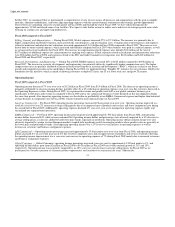
Software and Peripherals — Revenue from sales of software and peripherals ("S&P") consists of Dell-branded printers, monitors (not sold with
systems), projectors, and a multitude of competitively priced third-party peripherals including plasma and LCD televisions, software, and other
products. This revenue grew 7% year-over-year for Fiscal 2009, driven by strength in software licensing primarily due to our acquisition of ASAP
Software ("ASAP") in the fourth quarter of Fiscal 2008. With ASAP, we now offer products from over 2,000 software publishers. At a segment
level, Global Consumer led the revenue growth with a 13% year-over-year growth rate for Fiscal 2009. EMEA Commercial and Americas
Commercial both experienced revenue growth of 6% during Fiscal 2009. S&P revenue for APJ Commercial increased 5% year-over-year during
Fiscal 2009. We continue to believe that software licensing is a revenue growth opportunity as customers continue to seek out consolidated software
sources.
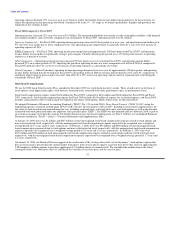
Servers and Networking — During Fiscal 2009 revenue from sales of servers and networking products decreased 3% year-over-year on a unit
increase of 4%. The decline in our server and networking revenue is due to demand challenges across all regions. To address the demand challenges
and drive growth, we adjusted our pricing and product strategy to shift our product offerings to lower price bands. Consequently, our average selling
price for servers and networking products decreased 7% year-over-year during Fiscal 2009. During Fiscal 2009, we experienced double digit growth
in blades, 4-Socket rack servers, and our cloud computing initiatives. We expanded our server coverage to 88% of the server space, and we plan to
increase our coverage to 95% next year. For calendar 2008, we were again ranked number one in the United States with a 35% share in server units
shipped; worldwide, we were second with a 26% share. During the fiscal year, we have released our broadest lineup of dedicated virtualization
solutions ever, including more than a dozen new servers, tools, and services, as a part of our mission to help companies of all sizes simplify their IT
environments.
Services — Services consists of a wide range of services including assessment, design and implementation, deployment, asset recovery and
recycling, training, enterprise support, client support, and managed lifecycle. Services revenue increased 7% year-over-year for Fiscal 2009 to
$5.7 billion, as our annuity of deferred services revenue amortization increases in our Americas Commercial segment and a 10% year-over-year
increase in consulting services revenue for Fiscal 2009. The increase in services revenue was also aided by our new
27