Dell 2008 Annual Report Download - page 57
Download and view the complete annual report
Please find page 57 of the 2008 Dell annual report below. You can navigate through the pages in the report by either clicking on the pages listed below, or by using the keyword search tool below to find specific information within the annual report.-
 1
1 -
2
-
3
-
4
-
5
-
6
-
7
-
8
-
9
-
10
-
11
-
12
-
13
-
14
-
15
-
16
-
17
-
18
-
19
-
20
-
21
-
22
-
23
-
24
-
25
-
26
-
27
-
28
-
29
-
30
-
31
-
32
-
33
-
34
-
35
-
36
-
37
-
38
-
39
-
40
-
41
-
42
-
43
-
44
-
45
-
46
-
 47
47 -
 48
48 -
 49
49 -
 50
50 -
 51
51 -
 52
52 -
 53
53 -
 54
54 -
 55
55 -
 56
56 -
 57
57 -
 58
58 -
 59
59 -
 60
60 -
 61
61 -
 62
62 -
 63
63 -
 64
64 -
 65
65 -
 66
66 -
 67
67 -
68
-
69
-
70
-
71
-
72
-
73
-
74
-
75
-
76
-
77
-
78
-
79
-
80
-
81
-
82
-
83
-
84
-
85
-
86
-
87
-
88
-
89
-
90
-
91
-
92
-
93
-
94
-
95
-
96
-
97
-
98
-
99
-
100
-
101
-
102
-
103
-
104
-
105
-
106
-
107
-
108
-
109
-
110
-
111
-
112
-
113
-
114
-
115
-
116
-
117
-
118
-
119
-
120
-
121
-
122
-
123
-
124
-
125
-
126
-
127
-
128
-
129
-
130
-
131
-
132
-
133
-
134
-
135
-
136
-
137
-
138
-
139
-
140
-
141
-
142
-
143
-
144
-
145
-
146
-
147
-
148
-
149
-
150
-
151
-
152
-
153
-
154
-
155
-
156
-
157
-
158
-
159
-
160
-
161
-
162
-
163
-
164
-
165
-
166
-
167
-
168
-
169
-
170
-
171
-
172
-
173
-
174
-
175
-
176
-
177
-
178
-
179
-
180
-
181
-
182
-
183
-
184
-
185
-
186
-
187
-
188
-
189
-
190
-
191
-
192
 |
 |
Table of Contents
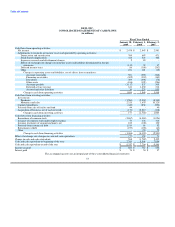
DELL INC.
CONSOLIDATED STATEMENTS OF CASH FLOWS
(in millions)
Fiscal Year Ended
January 30, February 1, February 2,
2009 2008 2007
Cash flows from operating activities:
Net income $ 2,478 $ 2,947 $ 2,583
Adjustments to reconcile net income to net cash provided by operating activities:
Depreciation and amortization 769 607 471
Stock-based compensation 418 329 368
In-process research and development charges 2 83 -
Effects of exchange rate changes on monetary assets and liabilities denominated in foreign
currencies (115) 30 37
Deferred income taxes 86 (308) (262)
Other 231 121 (19)
Changes in operating assets and liabilities, net of effects from acquisitions:
Accounts receivable 591 (990) (542)
Financing receivables (302) (394) (163)
Inventories 309 (498) (72)
Other assets (106) (121) (286)
Accounts payable (3,117) 837 505
Deferred service revenue 611 1,032 516
Accrued and other liabilities 39 274 833
Change in cash from operating activities 1,894 3,949 3,969
Cash flows from investing activities:
Investments:
Purchases (1,584) (2,394) (8,343)
Maturities and sales 2,333 3,679 10,320
Capital expenditures (440) (831) (896)
Proceeds from sale of facility and land 44 - 40
Acquisition of business, net of cash received (176) (2,217) (118)
Change in cash from investing activities 177 (1,763) 1,003
Cash flows from financing activities:
Repurchase of common stock (2,867) (4,004) (3,026)
Issuance of common stock under employee plans 79 136 314
Issuance (payment) of commercial paper, net 100 (100) 100
Proceeds from issuance of debt 1,519 66 52
Repayments of debt (237) (165) (63)
Other - (53) 72
Change in cash from financing activities (1,406) (4,120) (2,551)
Effect of exchange rate changes on cash and cash equivalents (77) 152 71
Change in cash and cash equivalents 588 (1,782) 2,492
Cash and cash equivalents at beginning of the year 7,764 9,546 7,054
Cash and cash equivalents at end of the year $ 8,352 $ 7,764 $ 9,546
Income tax paid $ 800 $ 767 $ 652
Interest paid $ 74 $ 54 $ 57
The accompanying notes are an integral part of these consolidated financial statements.
53