Dell 2008 Annual Report Download - page 35
Download and view the complete annual report
Please find page 35 of the 2008 Dell annual report below. You can navigate through the pages in the report by either clicking on the pages listed below, or by using the keyword search tool below to find specific information within the annual report.-
 1
1 -
2
-
3
-
4
-
5
-
6
-
7
-
8
-
9
-
10
-
11
-
12
-
13
-
14
-
15
-
16
-
17
-
18
-
19
-
20
-
21
-
22
-
23
-
24
-
 25
25 -
 26
26 -
 27
27 -
 28
28 -
 29
29 -
 30
30 -
 31
31 -
 32
32 -
 33
33 -
 34
34 -
 35
35 -
 36
36 -
 37
37 -
 38
38 -
 39
39 -
 40
40 -
 41
41 -
 42
42 -
 43
43 -
 44
44 -
 45
45 -
46
-
47
-
48
-
49
-
50
-
51
-
52
-
53
-
54
-
55
-
56
-
57
-
58
-
59
-
60
-
61
-
62
-
63
-
64
-
65
-
66
-
67
-
68
-
69
-
70
-
71
-
72
-
73
-
74
-
75
-
76
-
77
-
78
-
79
-
80
-
81
-
82
-
83
-
84
-
85
-
86
-
87
-
88
-
89
-
90
-
91
-
92
-
93
-
94
-
95
-
96
-
97
-
98
-
99
-
100
-
101
-
102
-
103
-
104
-
105
-
106
-
107
-
108
-
109
-
110
-
111
-
112
-
113
-
114
-
115
-
116
-
117
-
118
-
119
-
120
-
121
-
122
-
123
-
124
-
125
-
126
-
127
-
128
-
129
-
130
-
131
-
132
-
133
-
134
-
135
-
136
-
137
-
138
-
139
-
140
-
141
-
142
-
143
-
144
-
145
-
146
-
147
-
148
-
149
-
150
-
151
-
152
-
153
-
154
-
155
-
156
-
157
-
158
-
159
-
160
-
161
-
162
-
163
-
164
-
165
-
166
-
167
-
168
-
169
-
170
-
171
-
172
-
173
-
174
-
175
-
176
-
177
-
178
-
179
-
180
-
181
-
182
-
183
-
184
-
185
-
186
-
187
-
188
-
189
-
190
-
191
-
192
 |
 |

Table of Contents
In May 2007, we announced that we had initiated a comprehensive review of costs across all processes and organizations with the goal to simplify
structure, eliminate redundancies, and better align operating expenses with the current business environment and strategic growth opportunities.
These efforts are continuing. Since the second quarter of Fiscal 2008 and through the end of Fiscal 2009, we have reduced headcount by
approximately 13,500 and closed some of our facilities. We expect to take further actions to reduce costs and invest in strategic growth areas while
focusing on scaling costs and improving productivity.
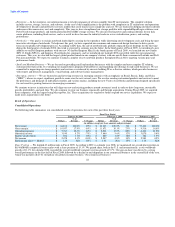
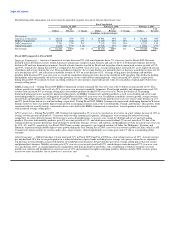
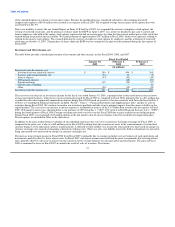
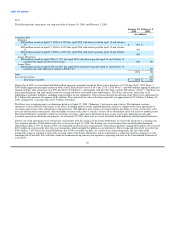
Fiscal 2008 compared to Fiscal 2007
Selling, General, and Administrative — During Fiscal 2008, SG&A expenses increased 27% to $7.5 billion. The increase was primarily due to
higher compensation and benefits expense, increased outside consulting fees, and investigation costs. Compensation-related expenses and expenses
related to headcount and infrastructure reductions increased approximately $1.0 billion in Fiscal 2008 compared to Fiscal 2007. This increase was
driven both by bonus-related expenses, which increased substantially compared to Fiscal 2007 when bonuses were paid at a reduced amount, as well
as an increased average headcount for Fiscal 2008. The increase in compensation related expenses also includes $76 million (of the total of
$107 million) of additional expense for cash payments for expiring stock options. SG&A expenses related to headcount and infrastructure reductions
were $92 million for Fiscal 2008, and expenses related to the SEC and Audit Committee investigations were $160 million and $100 million for
Fiscal 2008 and Fiscal 2007, respectively.
Research, Development, and Engineering — During Fiscal 2008, RD&E expenses increased 22% to $610 million compared to $498 million in
Fiscal 2007. The increase in research, development, and engineering was primarily driven by significantly higher compensation costs. The higher
compensation costs are partially attributed to increased focused investments in research and development ("R&D"), which are critical to our future
growth and competitive position in the marketplace. During Fiscal 2008, we implemented our "Simplify IT" initiative for our customers. R&D is the
foundation for this initiative, which is aimed at allowing customers to deploy IT faster, run IT at a lower total cost, and grow IT smarter.
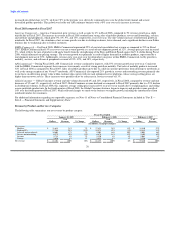
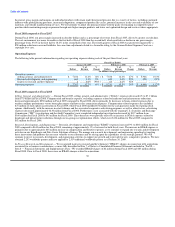
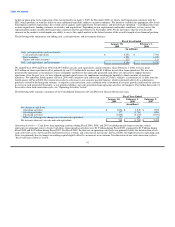
Operating Income
Fiscal 2009 compared to Fiscal 2008
Operating income decreased 7% year-over-year to $3.2 billion in Fiscal 2009 from $3.4 billion in Fiscal 2008. The decrease in operating income is
primarily attributable to our gross margin decline, partially offset by a 6% reduction in operating expenses year-over-year due to factors discussed in
the Operating Expenses section. During Fiscal 2009, we experienced customer and product mix shift as our global consumer business grew
significantly in both units and revenue as compared to Fiscal 2008 and as our commercial business revenue declined on flat unit shipments during
the same time period. Also impacting operating income was the decline in profitability in our EMEA Commercial segment and higher than historical
average declines in component costs in Fiscal 2008, which returned to more typical declines in Fiscal 2009.
Americas Commercial — For Fiscal 2009, operating income percentage increased 40 basis points year-over-year. Operating income improved as a
result of a year-over-year 2% increase in average selling prices due to an improved mix of products and services and lower component costs during
the second half of Fiscal 2009. Additionally, operating expenses declined 4% year-over-year as we managed our operating expenses tightly and
streamlined our organizational operations.
EMEA Commercial — For Fiscal 2009, operating income percentage decreased approximately 300 basis points from Fiscal 2008, and operating
income dollars decreased 44% while revenue remained flat. Operating income dollars and percentage were adversely impacted by a 6% decrease in
average selling prices as sales mix shifted toward lower price bands, especially in notebooks. Operating income dollars and percentage were also
adversely impacted by weaker western European markets coupled with significant growth in emerging markets where product sales are generally in
the lower price and profitability bands. Also impacting operating income was a 2% year-over-year increase in operating expenses as well as
increases in severance and business realignment expenses.
APJ Commercial — Operating income percentage increased approximately 30 basis points year-over-year from Fiscal 2008, and operating income
dollars increased 8% on a revenue increase of 2% due to lower component costs and an improved mix of products and services. Partially offsetting
the operating income improvement was a year-over-year increase in operating expenses of 7% during Fiscal 2009 mainly due to increased severance
and business realignment expenses.
Global Consumer — Global Consumer's operating income percentage increased year-over-year by approximately 120 basis points to 1%, and
operating income dollars grew from $2 million in Fiscal 2008 to $143 million in Fiscal 2009 on revenue and unit growth of 11% and 35%,
respectively. Operating income was negatively impacted by an 18% year-over-year decrease in average selling prices for Fiscal 2009 as we
participated in a broader spectrum of consumer product opportunities and continued our expansion into retail. Additionally,
31