Dell 2008 Annual Report Download - page 93
Download and view the complete annual report
Please find page 93 of the 2008 Dell annual report below. You can navigate through the pages in the report by either clicking on the pages listed below, or by using the keyword search tool below to find specific information within the annual report.-
 1
1 -
2
-
3
-
4
-
5
-
6
-
7
-
8
-
9
-
10
-
11
-
12
-
13
-
14
-
15
-
16
-
17
-
18
-
19
-
20
-
21
-
22
-
23
-
24
-
25
-
26
-
27
-
28
-
29
-
30
-
31
-
32
-
33
-
34
-
35
-
36
-
37
-
38
-
39
-
40
-
41
-
42
-
43
-
44
-
45
-
46
-
47
-
48
-
49
-
50
-
51
-
52
-
53
-
54
-
55
-
56
-
57
-
58
-
59
-
60
-
61
-
62
-
63
-
64
-
65
-
66
-
67
-
68
-
69
-
70
-
71
-
72
-
73
-
74
-
75
-
76
-
77
-
78
-
79
-
80
-
81
-
82
-
 83
83 -
 84
84 -
 85
85 -
 86
86 -
 87
87 -
 88
88 -
 89
89 -
 90
90 -
 91
91 -
 92
92 -
 93
93 -
 94
94 -
 95
95 -
 96
96 -
 97
97 -
 98
98 -
 99
99 -
 100
100 -
 101
101 -
 102
102 -
 103
103 -
104
-
105
-
106
-
107
-
108
-
109
-
110
-
111
-
112
-
113
-
114
-
115
-
116
-
117
-
118
-
119
-
120
-
121
-
122
-
123
-
124
-
125
-
126
-
127
-
128
-
129
-
130
-
131
-
132
-
133
-
134
-
135
-
136
-
137
-
138
-
139
-
140
-
141
-
142
-
143
-
144
-
145
-
146
-
147
-
148
-
149
-
150
-
151
-
152
-
153
-
154
-
155
-
156
-
157
-
158
-
159
-
160
-
161
-
162
-
163
-
164
-
165
-
166
-
167
-
168
-
169
-
170
-
171
-
172
-
173
-
174
-
175
-
176
-
177
-
178
-
179
-
180
-
181
-
182
-
183
-
184
-
185
-
186
-
187
-
188
-
189
-
190
-
191
-
192
 |
 |
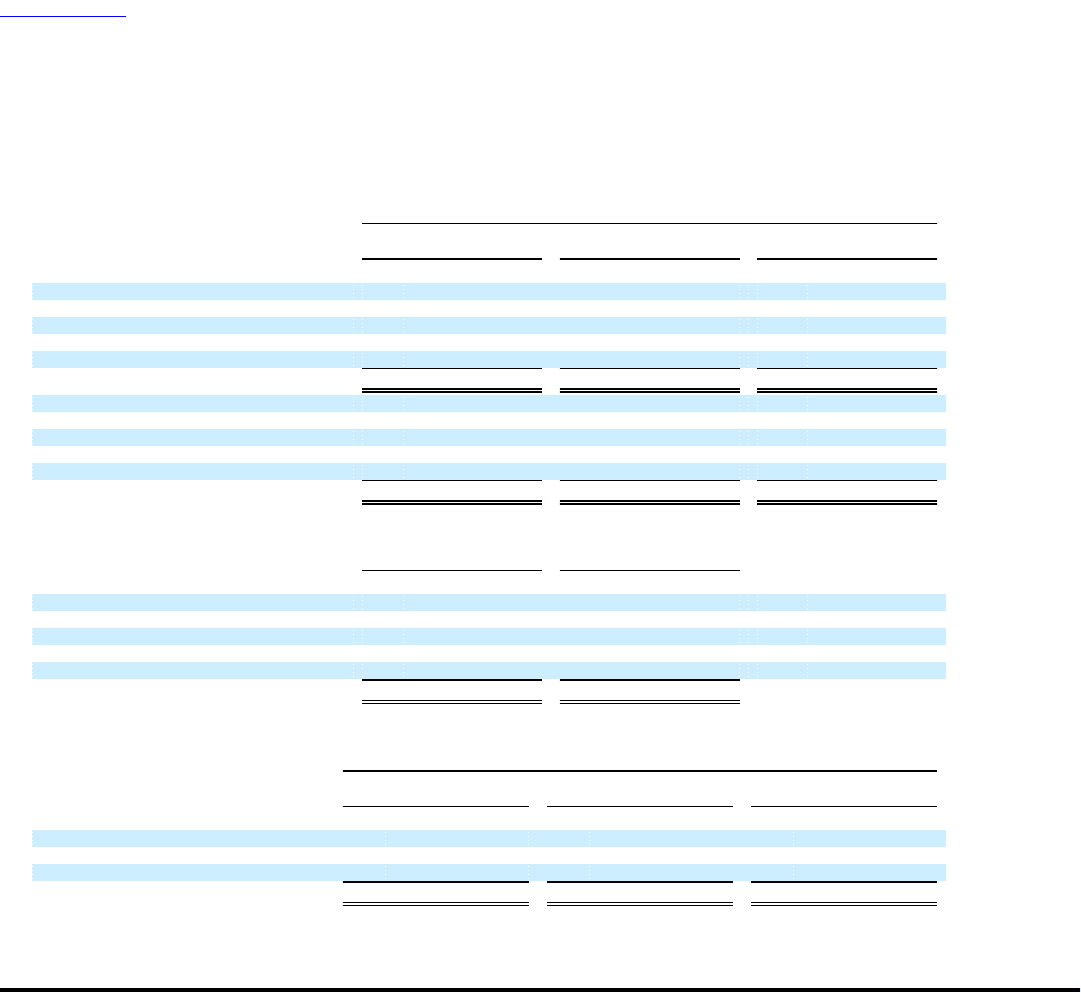
Table of Contents
DELL INC.
NOTES TO CONSOLIDATED FINANCIAL STATEMENTS (Continued)
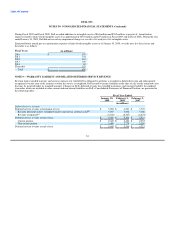
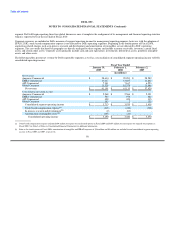
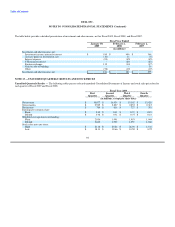
The following tables present depreciation expense and capital expenditures by Dell's reportable segments and assets by region:
Fiscal Year Ended
January 30, February 1, February 2,
2009 2008 2007
(in millions)
Depreciation expense:
Americas Commercial $ 355 $ 286 $ 214
EMEA Commercial 101 124 95
APJ Commercial 80 86 71
Global Consumer 130 103 91
Total $ 666 $ 599 $ 471
Capital expenditures:
Americas Commercial $ 242 $ 387 $ 490
EMEA Commercial 54 179 125
APJ Commercial 56 125 103
Global Consumer 88 140 178
Total $ 440 $ 831 $ 896
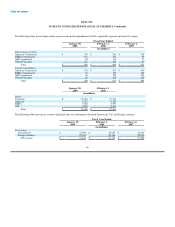
January 30, February 1,
2009 2008
(in millions)
Assets:
Corporate $ 12,664 $ 15,336
Americas 8,781 6,524
EMEA 3,026 3,597
APJ 2,029 2,104
Total $ 26,500 $ 27,561
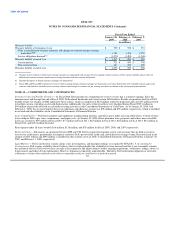
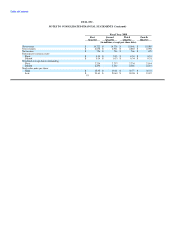
The following tables present net revenue and long-lived asset information allocated between the U.S. and foreign countries:
Fiscal Year Ended
January 30, February 1, February 2,
2009 2008 2007
(in millions)
Net revenue:
United States $ 31,569 $ 32,687 $ 32,361
Foreign countries 29,532 28,446 25,059
Net revenue $ 61,101 $ 61,133 $ 57,420
89