Dell 2008 Annual Report Download - page 24
Download and view the complete annual report
Please find page 24 of the 2008 Dell annual report below. You can navigate through the pages in the report by either clicking on the pages listed below, or by using the keyword search tool below to find specific information within the annual report.-
 1
1 -
2
-
3
-
4
-
5
-
6
-
7
-
8
-
9
-
10
-
11
-
12
-
13
-
 14
14 -
 15
15 -
 16
16 -
 17
17 -
 18
18 -
 19
19 -
 20
20 -
 21
21 -
 22
22 -
 23
23 -
 24
24 -
 25
25 -
 26
26 -
 27
27 -
 28
28 -
 29
29 -
 30
30 -
 31
31 -
 32
32 -
 33
33 -
 34
34 -
35
-
36
-
37
-
38
-
39
-
40
-
41
-
42
-
43
-
44
-
45
-
46
-
47
-
48
-
49
-
50
-
51
-
52
-
53
-
54
-
55
-
56
-
57
-
58
-
59
-
60
-
61
-
62
-
63
-
64
-
65
-
66
-
67
-
68
-
69
-
70
-
71
-
72
-
73
-
74
-
75
-
76
-
77
-
78
-
79
-
80
-
81
-
82
-
83
-
84
-
85
-
86
-
87
-
88
-
89
-
90
-
91
-
92
-
93
-
94
-
95
-
96
-
97
-
98
-
99
-
100
-
101
-
102
-
103
-
104
-
105
-
106
-
107
-
108
-
109
-
110
-
111
-
112
-
113
-
114
-
115
-
116
-
117
-
118
-
119
-
120
-
121
-
122
-
123
-
124
-
125
-
126
-
127
-
128
-
129
-
130
-
131
-
132
-
133
-
134
-
135
-
136
-
137
-
138
-
139
-
140
-
141
-
142
-
143
-
144
-
145
-
146
-
147
-
148
-
149
-
150
-
151
-
152
-
153
-
154
-
155
-
156
-
157
-
158
-
159
-
160
-
161
-
162
-
163
-
164
-
165
-
166
-
167
-
168
-
169
-
170
-
171
-
172
-
173
-
174
-
175
-
176
-
177
-
178
-
179
-
180
-
181
-
182
-
183
-
184
-
185
-
186
-
187
-
188
-
189
-
190
-
191
-
192
 |
 |
Table of Contents
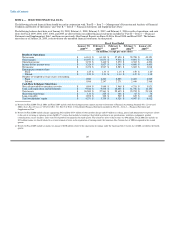
ITEM 6 — SELECTED FINANCIAL DATA
The following selected financial data should be read in conjunction with "Part II — Item 7 — Management's Discussion and Analysis of Financial
Condition and Results of Operations" and "Part II — Item 8 — Financial Statements and Supplementary Data."
The following balance sheet data as of January 30, 2009, February 1, 2008, February 2, 2007, and February 3, 2006, results of operations, and cash
flows for Fiscal 2009, 2008, 2007, 2006, and 2005 are derived from our audited financial statements included in "Part II — Item 8 — Financial
Statements and Supplementary Data" and from our previously filed Annual Reports on Form 10-K for Fiscal 2008 and Fiscal 2007. The balance
sheet data as of January 28, 2005, is derived from our unaudited financial statements for that period.
Fiscal Year Ended
January 30, February 1, February 2, February 3, January 28,
2009(a) 2008(a) 2007(a) 2006(b) 2005(c)
(in millions, except per share data)
Results of Operations:
Net revenue $ 61,101 $ 61,133 $ 57,420 $ 55,788 $ 49,121
Gross margin $ 10,957 $ 11,671 $ 9,516 $ 9,891 $ 9,018
Operating income $ 3,190 $ 3,440 $ 3,070 $ 4,382 $ 4,206
Income before income taxes $ 3,324 $ 3,827 $ 3,345 $ 4,608 $ 4,403
Net income $ 2,478 $ 2,947 $ 2,583 $ 3,602 $ 3,018
Earnings per common share:
Basic $ 1.25 $ 1.33 $ 1.15 $ 1.50 $ 1.20
Diluted $ 1.25 $ 1.31 $ 1.14 $ 1.47 $ 1.18
Number of weighted-average shares outstanding:
Basic 1,980 2,223 2,255 2,403 2,509
Diluted 1,986 2,247 2,271 2,449 2,568
Cash Flow & Balance Sheet Data:
Net cash provided by operating activities $ 1,894 $ 3,949 $ 3,969 $ 4,751 $ 5,821
Cash, cash equivalents and investments $ 9,546 $ 9,532 $ 12,445 $ 11,756 $ 14,101
Total assets $ 26,500 $ 27,561 $ 25,635 $ 23,252 $ 23,318
Short-term borrowings $ 113 $ 225 $ 188 $ 65 $ 74
Long-term debt $ 1,898 $ 362 $ 569 $ 625 $ 662
Total stockholders' equity $ 4,271 $ 3,735 $ 4,328 $ 4,047 $ 6,412
(a) Results for Fiscal 2009, Fiscal 2008, and Fiscal 2007 include stock-based compensation expense pursuant to Statement of Financial Accounting Standards No. 123 (revised
2004), Share-Based Payment ("SFAS 123(R)"). See Note 5 of Notes to Consolidated Financial Statements included in "Part II — Item 8 — Financial Statements and
Supplementary Data."
(b) Results for Fiscal 2006 include charges aggregating $421 million ($338 million of other product charges and $83 million in selling, general and administrative expenses) related
to the cost of servicing or replacing certain OptiPlexTM systems that included a vendor part that failed to perform to our specifications, workforce realignment, product
rationalizations, excess facilities, and a write-off of goodwill recognized in the third quarter. The related tax effect of these items was $96 million. Fiscal 2006 also includes an
$85 million income tax benefit related to a revised estimate of taxes on the repatriation of earnings under the American Jobs Creation Act of 2004 recognized in the second
quarter.
(c) Results for Fiscal 2005 include an income tax charge of $280 million related to the repatriation of earnings under the American Jobs Creation Act of 2004 recorded in the fourth
quarter.
20