Costco 2010 Annual Report Download - page 72
Download and view the complete annual report
Please find page 72 of the 2010 Costco annual report below. You can navigate through the pages in the report by either clicking on the pages listed below, or by using the keyword search tool below to find specific information within the annual report.-
 1
1 -
2
-
3
-
4
-
5
-
6
-
7
-
8
-
9
-
10
-
11
-
12
-
13
-
14
-
15
-
16
-
17
-
18
-
19
-
20
-
21
-
22
-
23
-
24
-
25
-
26
-
27
-
28
-
29
-
30
-
31
-
32
-
33
-
34
-
35
-
36
-
37
-
38
-
39
-
40
-
41
-
42
-
43
-
44
-
45
-
46
-
47
-
48
-
49
-
50
-
51
-
52
-
53
-
54
-
55
-
56
-
57
-
58
-
59
-
60
-
61
-
 62
62 -
 63
63 -
 64
64 -
 65
65 -
 66
66 -
 67
67 -
 68
68 -
 69
69 -
 70
70 -
 71
71 -
 72
72 -
 73
73 -
 74
74 -
 75
75 -
 76
76 -
 77
77 -
 78
78 -
 79
79 -
 80
80 -
 81
81 -
 82
82 -
83
-
84
-
85
-
86
-
87
-
88
 |
 |

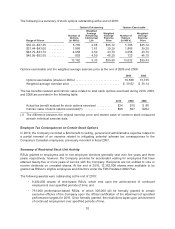
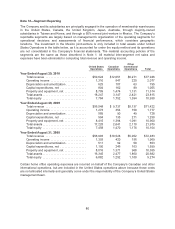
The following is a summary of stock options outstanding at the end of 2010:
Options Outstanding Options Exercisable
Range of Prices
Number of
Options
(in 000’s)
Weighted
Average
Remaining
Contractual
Life
Weighted
Average
Exercise
Price
Number of
Options
(in 000’s)
Weighted-
Average
Exercise
Price
$30.41–$37.35 ........... 5,785 2.68 $35.12 5,785 $35.12
$37.44–$43.00 ........... 1,866 1.61 39.29 1,866 39.29
$43.79–$43.79 ........... 4,658 4.59 43.79 4,658 43.79
$45.99–$52.50 ........... 853 4.59 46.20 723 46.15
13,162 3.33 $39.50 13,032 $39.43
Options exercisable and the weighted average exercise price at the end of 2009 and 2008:
2009 2008
Options exercisable (shares in 000’s) ............................ 16,588 15,735
Weighted average exercise price ............................... $ 39.62 $ 39.14
The tax benefits realized and intrinsic value related to total stock options exercised during 2010, 2009,
and 2008 are provided in the following table:
2010 2009 2008
Actual tax benefit realized for stock options exercised ......... $34 $10 $ 86
Intrinsic value of stock options exercised(1) ................. $98 $27 $262
(1) The difference between the original exercise price and market value of common stock measured
at each individual exercise date.
Employee Tax Consequences on Certain Stock Options
In 2010, the Company recorded a $24 benefit to selling, general and administrative expense related to
a partial reversal of an expense related to mitigating potential adverse tax consequences to the
Company’s Canadian employees, previously recorded in fiscal 2007.
Summary of Restricted Stock Unit Activity
RSUs granted to employees and to non-employee directors generally vest over five years and three
years, respectively; however, the Company provides for accelerated vesting for employees that have
attained twenty-five or more years of service with the Company. Recipients are not entitled to vote or
receive dividends on unvested shares. At the end of 2010, 12,362,000 shares were available to be
granted as RSUs to eligible employees and directors under the Fifth Restated 2002 Plan.
The following awards were outstanding at the end of 2010:
• 8,492,000 shares of time-based RSUs, which vest upon the achievement of continued
employment over specified periods of time; and
• 761,000 performance-based RSUs, of which 305,000 will be formally granted to certain
executive officers of the Company upon the official certification of the attainment of specified
performance targets for 2010. Once formally granted, the restrictions lapse upon achievement
of continued employment over specified periods of time.
70