Costco 2010 Annual Report Download - page 33
Download and view the complete annual report
Please find page 33 of the 2010 Costco annual report below. You can navigate through the pages in the report by either clicking on the pages listed below, or by using the keyword search tool below to find specific information within the annual report.-
 1
1 -
2
-
3
-
4
-
5
-
6
-
7
-
8
-
9
-
10
-
11
-
12
-
13
-
14
-
15
-
16
-
17
-
18
-
19
-
20
-
21
-
22
-
 23
23 -
 24
24 -
 25
25 -
 26
26 -
 27
27 -
 28
28 -
 29
29 -
 30
30 -
 31
31 -
 32
32 -
 33
33 -
 34
34 -
 35
35 -
 36
36 -
 37
37 -
 38
38 -
 39
39 -
 40
40 -
 41
41 -
 42
42 -
 43
43 -
44
-
45
-
46
-
47
-
48
-
49
-
50
-
51
-
52
-
53
-
54
-
55
-
56
-
57
-
58
-
59
-
60
-
61
-
62
-
63
-
64
-
65
-
66
-
67
-
68
-
69
-
70
-
71
-
72
-
73
-
74
-
75
-
76
-
77
-
78
-
79
-
80
-
81
-
82
-
83
-
84
-
85
-
86
-
87
-
88
 |
 |

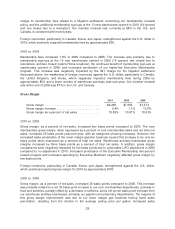
2010 vs. 2009
The decrease in interest income is due to lower interest rates on our cash and cash equivalents and
short-term investment balances. Interest income also includes a $12 other-than-temporary impairment
loss recognized on certain securities within our investment portfolio in 2009. No impairment was
recognized in 2010.
The increase in earnings of affiliates and other is primarily due to an increase in earnings from our 50%
owned joint-venture in Mexico. Costco Mexico’s earnings increased due to stronger sales and the
Mexican peso strengthening against the U.S. dollar. The net gain on foreign currency transactions was
$13 in 2010, but was not significant in 2009. These amounts generally relate to the difference between
the foreign exchange rate in effect when title to merchandise inventory is transferred and the rate at the
time of payment. In addition, there was a favorable $1 mark-to-market adjustment in 2010 compared to
a negative $5 adjustment in 2009, related to our forward foreign exchange contracts. See Derivatives
section for more information.
2009 vs. 2008
The decrease in interest income was largely due to lower interest rates on our cash and cash
equivalents and short-term investment balances resulting from a change in policy to invest primarily in
U.S. government and agency securities, which earn lower interest rates. In addition, we recognized
$12 of other-than-temporary impairment losses on certain securities within our investment portfolio in
2009 compared to an impairment loss of $5 in 2008. The decrease in the earnings of affiliates was
primarily attributable to lower earnings by our investment in Costco Mexico. Costco Mexico’s earnings
were lower in 2009, primarily due to the peso weakening against the U.S. dollar. In addition, there was
a negative $5 mark-to-market adjustment in 2009 compared to a favorable $6 adjustment in 2008,
related to our forward foreign exchange contracts.
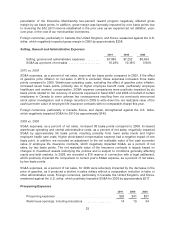
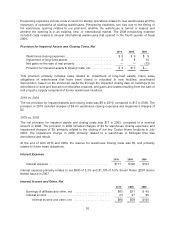
Provision for Income Taxes
2010 2009 2008
Income tax expense ........................... $731 $628 $716
Effective tax rate .............................. 35.6% 36.4% 35.6%
The decline in the effective tax rate from 2009 to 2010 is primarily attributable to a change in the mix of
earnings between domestic and international operations. The 2009 effective tax rates also include the
unfavorable impact of a write-down on investments that were non-deductible for tax purposes.
The lower tax rate in 2008 was primarily attributable to discrete benefits recognized during the year.
Net Income Attributable to Costco (Net Income)
2010 2009 2008
Net income ................................... $ 1,303 $ 1,086 $ 1,283
Net income per diluted share .................... $ 2.92 $ 2.47 $ 2.89
Shares used to calculate diluted net income per
diluted share (000’s) ......................... 445,970 440,454 444,240
Diluted net income per share increase / (decrease) . . 18% (15)% 22%
31