Costco 2010 Annual Report Download - page 3
Download and view the complete annual report
Please find page 3 of the 2010 Costco annual report below. You can navigate through the pages in the report by either clicking on the pages listed below, or by using the keyword search tool below to find specific information within the annual report.-
 1
1 -
 2
2 -
 3
3 -
 4
4 -
 5
5 -
 6
6 -
 7
7 -
 8
8 -
 9
9 -
 10
10 -
 11
11 -
 12
12 -
 13
13 -
 14
14 -
15
-
16
-
17
-
18
-
19
-
20
-
21
-
22
-
23
-
24
-
25
-
26
-
27
-
28
-
29
-
30
-
31
-
32
-
33
-
34
-
35
-
36
-
37
-
38
-
39
-
40
-
41
-
42
-
43
-
44
-
45
-
46
-
47
-
48
-
49
-
50
-
51
-
52
-
53
-
54
-
55
-
56
-
57
-
58
-
59
-
60
-
61
-
62
-
63
-
64
-
65
-
66
-
67
-
68
-
69
-
70
-
71
-
72
-
73
-
74
-
75
-
76
-
77
-
78
-
79
-
80
-
81
-
82
-
83
-
84
-
85
-
86
-
87
-
88
 |
 |
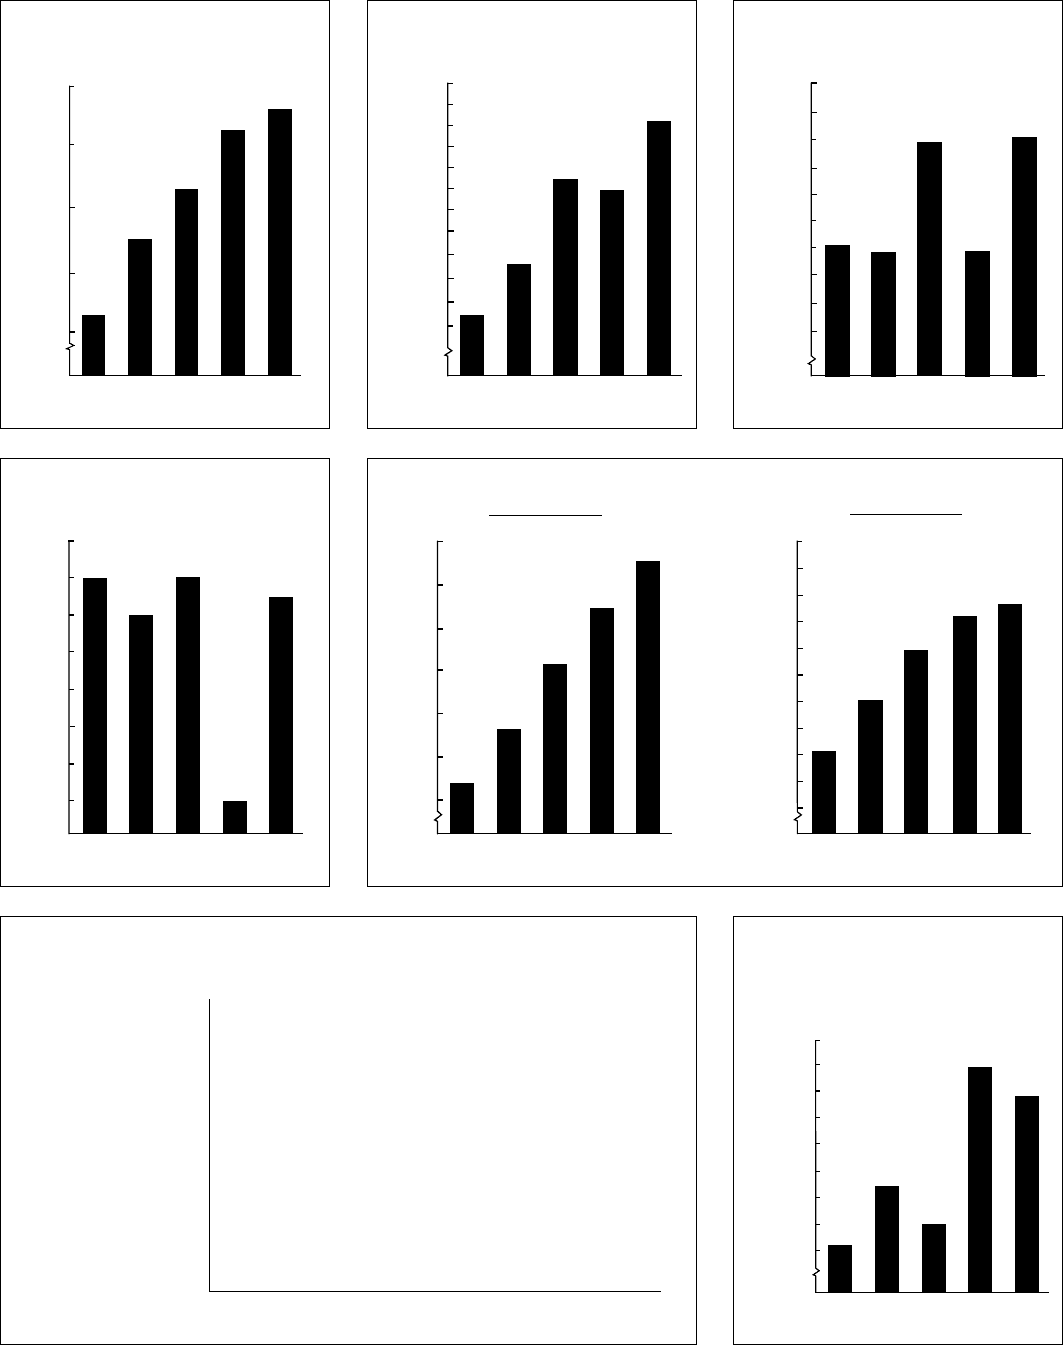
AverageSalesPerWarehouse*
(SalesInMillions)
2006
137
98
99
101
81
$92
$127
2005
129
88
81
91
$63
$120
2004
123
77
$72
79
$115
2003
112
62
$67
$105
2002
107
$58
$103
2001
$101
$101
540Totals
341
2001&Before
29
23
20
15
25
30
25
19
13
2002
2003
2004
2005
2006
2007
2008
2009
2010
Whses
Opened
#of
Year
2007
143
107
109
107
95
101
$76
$130
2008
152
115
121
116
110
118
88
$137
$86
2009
145
112
118
119
116
114
92
$131
83
$100
2010
154
117
126
128
126
122
103
99
$139
107
$94
Fiscal Year
NetIncome
Fiscal Year
$Millions
2006 2008
0
1,350
1,400
1,200
1,250
1,300
950
1,150
1,000
1,050
1,100
2009
1,103 1,083
2010
1,283
2007
1,086
1,303
WarehousesinOperation
At Fiscal Year End
NumberofWarehouses
2006 2008
(550 at 12/31/10)
0
450
475
500
2009
458
488
2010
512
2007
527
540
525
550
NetSales
Fiscal Year
$Millions
2006 2008 2009 2010
58,000
62,000
60,000
64,000
66,000
68,000
70,000
72,000
74,000
76,000
2007
58,963
63,088
70,977
0
78,000
80,000
69,889
76,255
ComparableSalesGrowth
Fiscal Year
PercentIncrease/Decrease
2006 2008 2009
-4%
-2%
0%
2%
4%
6%
8%
10%
8%
2010
6%
7%
2007
8%
-4%
Selling,Generaland
AdministrativeExpenses
Fiscal Year
PercentofNetSales
2006 2007
0
10.10%
10.20%
10.30%
10.40%
10.50%
9.90%
9.80%
10.00%
2008 2009
9.72%
2010
9.80%
9.70%
9.94%
10.38%
10.28%
At Fiscal Year End
2006 2008
5.0
5.2
5.4
5.6
5.8
6.0
0
2009
5.214
5.401
2010
5.594
2007
BusinessMembers
At Fiscal Year End
Millions
Millions
2006 2008
0
2009
17.338
18.619
2010
21.445
22.527
2007
GoldStarMembers
Membership
21
18
20
19
20.181
5.719
5.789
22
17
23
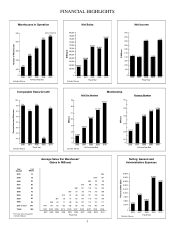
Financial highlights
Warehouses in Operation
Comparable Sales Growth
Average Sales Per Warehouse*
(Sales In Millions)
Selling, General and
Administrative Expenses
Membership
Net Sales Net Income
Excludes Mexico
Excludes Mexico
*First year sales annualized.
Excludes Mexico Excludes Mexico
Excludes Mexico
Excludes Mexico
1