Costco 2010 Annual Report Download - page 29
Download and view the complete annual report
Please find page 29 of the 2010 Costco annual report below. You can navigate through the pages in the report by either clicking on the pages listed below, or by using the keyword search tool below to find specific information within the annual report.-
 1
1 -
2
-
3
-
4
-
5
-
6
-
7
-
8
-
9
-
10
-
11
-
12
-
13
-
14
-
15
-
16
-
17
-
18
-
 19
19 -
 20
20 -
 21
21 -
 22
22 -
 23
23 -
 24
24 -
 25
25 -
 26
26 -
 27
27 -
 28
28 -
 29
29 -
 30
30 -
 31
31 -
 32
32 -
 33
33 -
 34
34 -
 35
35 -
 36
36 -
 37
37 -
 38
38 -
 39
39 -
40
-
41
-
42
-
43
-
44
-
45
-
46
-
47
-
48
-
49
-
50
-
51
-
52
-
53
-
54
-
55
-
56
-
57
-
58
-
59
-
60
-
61
-
62
-
63
-
64
-
65
-
66
-
67
-
68
-
69
-
70
-
71
-
72
-
73
-
74
-
75
-
76
-
77
-
78
-
79
-
80
-
81
-
82
-
83
-
84
-
85
-
86
-
87
-
88
 |
 |

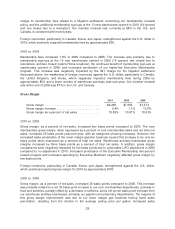
Our sales results continue to be negatively impacted by general economic conditions, and those
conditions may continue to have a significant adverse impact on spending by our members. We
believe, however, that due to the nature of our business model, we are better positioned than many
retailers to compete in such an environment.
Comparable Sales
Comparable sales increased 7% in 2010 and were positively impacted primarily by an increase in
shopping frequency. Strengthening foreign currencies positively impacted comparable sales by
approximately $1,510 (217 basis points) in 2010. Gasoline price inflation positively impacted
comparable sales results by approximately $882 (126 basis points) during 2010. Reported comparable
sales growth includes the negative impact of cannibalization (established warehouses losing sales to
our newly opened locations).
2009 vs. 2008
Net Sales
Our 2009 sales results, particularly in hardlines and softlines, were negatively impacted by general
economic conditions. Net sales decreased 1.5% during 2009 compared to 2008. The $1,088 decrease
was comprised of a $2,590 decrease in comparable sales, partially offset by an increase of $1,502
primarily from sales at new warehouses opened during 2009 and 2008. Our sales were also impacted
by a lower number of warehouse openings year-over-year.
Foreign currencies, particularly in Canada, the United Kingdom, and Korea, weakened against the U.S.
dollar, which negatively impacted net sales during 2009 by approximately $2,421 (341 basis points).
Net sales were also negatively impacted by gasoline price deflation during 2009 by approximately
$2,164 (305 basis points), which resulted from a 30% decline in the average sales price per gallon.
Comparable Sales
Comparable sales decreased 4% in 2009. Weakening foreign currencies negatively impacted
comparable sales by approximately $2,339 (333 basis points) in 2009. Gasoline price deflation
negatively impacted comparable sales results by approximately $2,113 (298 basis points) during 2009.
Comparable sales were negatively impacted by a decline in the average amount spent (after
adjustment for gasoline price deflation and measured in local currencies), partially offset by an
increase in shopping frequency. Reported comparable sales growth includes the negative impact of
cannibalization.
Membership Fees
2010 2009 2008
Membership fees ............................. $ 1,691 $ 1,533 $ 1,506
Membership fees increase ..................... 10.3% 1.8% 14.7%
Membership fees as a percent of net sales ........ 2.22% 2.19% 2.12%
Total cardholders (000’s) ....................... 58,000 56,000 53,500
2010 vs. 2009
Membership fees increased 10.3% in 2010 compared to 2009. Membership fees in 2010 were
positively impacted due to the increased penetration of our higher-fee Executive Membership program,
the continued benefit of membership sign-ups at warehouses opened in 2009 and 2008, a 2009 $27
27