Costco 2010 Annual Report Download - page 66
Download and view the complete annual report
Please find page 66 of the 2010 Costco annual report below. You can navigate through the pages in the report by either clicking on the pages listed below, or by using the keyword search tool below to find specific information within the annual report.-
 1
1 -
2
-
3
-
4
-
5
-
6
-
7
-
8
-
9
-
10
-
11
-
12
-
13
-
14
-
15
-
16
-
17
-
18
-
19
-
20
-
21
-
22
-
23
-
24
-
25
-
26
-
27
-
28
-
29
-
30
-
31
-
32
-
33
-
34
-
35
-
36
-
37
-
38
-
39
-
40
-
41
-
42
-
43
-
44
-
45
-
46
-
47
-
48
-
49
-
50
-
51
-
52
-
53
-
54
-
55
-
 56
56 -
 57
57 -
 58
58 -
 59
59 -
 60
60 -
 61
61 -
 62
62 -
 63
63 -
 64
64 -
 65
65 -
 66
66 -
 67
67 -
 68
68 -
 69
69 -
 70
70 -
 71
71 -
 72
72 -
 73
73 -
 74
74 -
 75
75 -
 76
76 -
77
-
78
-
79
-
80
-
81
-
82
-
83
-
84
-
85
-
86
-
87
-
88
 |
 |

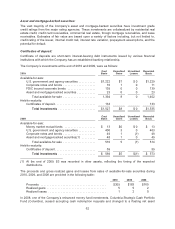
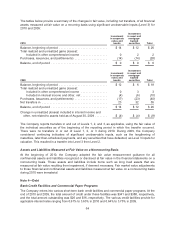
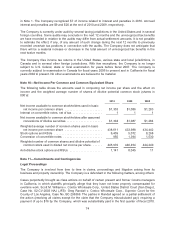
The tables below provide a summary of the changes in fair value, including net transfers, of all financial
assets measured at fair value on a recurring basis using significant unobservable inputs (Level 3) for
2010 and 2009:
2010
Investment
in corporate
notes and
bonds
Investment
in asset and
mortgage-
backed
securities Total
Balance, beginning of period ............................... $14 $12 $26
Total realized and unrealized gains (losses):
Included in other comprehensive income ................. 0 2 2
Purchases, issuances, and (settlements) ..................... (14) (14) (28)
Balance, end of period .................................... $ 0 $ 0 $ 0
2009
Investment
in corporate
notes and
bonds
Investment
in asset and
mortgage-
backed
securities Total
Balance, beginning of period ............................... $12 $ 6 $18
Total realized and unrealized gains (losses):
Included in other comprehensive income ................. 0 3 3
Included in interest income and other, net ................. (4) (6) (10)
Purchases, issuances, and (settlements) ..................... (17) (23) (40)
Net transfers in .......................................... 23 32 55
Balance, end of period .................................... $14 $12 $26
Change in unrealized (losses) included in interest income and
other, net related to assets held as of August 30, 2009 ........ $ (4) $ (4) $ (8)
The Company reports transfers in and out of Levels 1, 2, and 3, as applicable, using the fair value of
the individual securities as of the beginning of the reporting period in which the transfer occurred.
There were no transfers in or out of Level 1, 2, or 3 during 2010. During 2009, the Company
considered continuing indicators of significant unobservable inputs, such as the lengthening of
maturities, later-than-scheduled payments, and any securities that have defaulted, as Level 3 inputs for
valuation. This resulted in a transfer into Level 3 from Level 2.
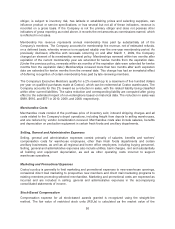
Assets and Liabilities Measured at Fair Value on a Nonrecurring Basis
At the beginning of 2010, the Company adopted the fair value measurement guidance for all
nonfinancial assets and liabilities recognized or disclosed at fair value in the financial statements on a
nonrecurring basis. These assets and liabilities include items such as long lived assets that are
measured at fair value resulting from impairment, if deemed necessary. Fair market value adjustments
to those financial and nonfinancial assets and liabilities measured at fair value on a nonrecurring basis
during 2010 were immaterial.
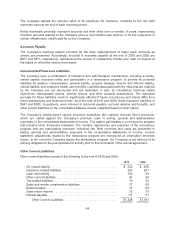
Note 4—Debt
Bank Credit Facilities and Commercial Paper Programs
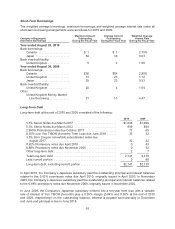
The Company enters into various short-term bank credit facilities and commercial paper programs. At the
end of 2010 and 2009, the total amount of credit under these facilities was $341 and $388, respectively,
and the total amount outstanding was $26 and $16, respectively. The various credit facilities provide for
applicable interest rates ranging from 0.61% to 3.63% in 2010 and 0.64% to 3.75% in 2009.
64